Every now and again, Political Calculations(TM) makes a point of pointing out other sites that provide useful tools that help people do the math that affects their lives. Today, just for fun, I thought I'd track down the tools created by Hugh Chou - one of the real pioneers of bringing tools for solving personal finance problems to the web, whose blend of commentary and practical problem solving has provided some of the inspiration for this site.
Selected at random from Hugh's site:
- The Mortgage Calculator
- How Much House Can You Afford?
- Stop Buying Expensive Coffee and Save Calculator
- Medical Savings Account Calculator
- Millionaire Women Next Door Calculator
I was also pleased to discover that Hugh was profiled by the Milwaukee Journal Sentinel back in 2002, and more recently in Washington University's Record. Go visit Hugh's site today - he has over 60 useful tools waiting for you!
The seeming-to-be-ever-growing size of the U.S. National Debt was in the news just a little over a month ago, as it has been estimated to have just recently passed the $8.0 trillion USD mark (back on October 18, 2005). We here at Political Calculations thought it might be fun to look at the national debt through the last 105 years, so we can compare it to the United States’ national income (as measured by nominal GDP, which has recently crossed the $12.5 trillion USD mark). The following chart shows both figures through the years, with the black line representing U.S. nominal GDP and the red line representing the United States’ national debt:

What’s important in looking at this chart is the vertical spread between national income and national debt. We can see that the spread has widened over time, which is a positive trend – it shows that the growth of national income is outpacing the growth the national debt. The best years for this trend occurred in the late 1990s, as the U.S. ran budget surpluses (keeping the national debt from growing), but an important factor to note is that this trend has continued to the present day as the pace of economic growth has generally been greater than the growth of the nation's debt.
More information:
U.S. National Debt
U.S. Nominal Gross Domestic Product (GDP)
- U.S. Bureau of Economic Analysis, GDP Estimate (9/30/2005)
- Economic History, Nominal GDP 1900-2004
Labels: national debt
What happens when a bunch of political hacks want to use economic data to paint a picture they want to see? Well, I won't keep you in suspense. What you get is a pretty dazzling display of ignorance - a highly filtered view of reality that uses the con man's tool of distraction to hide the inconvenient truths that otherwise repudiate their political objectives, all while plainly demonstrating that the hacks in question only care about paying lip-service to a political constituency without actually caring about their real needs or even understanding how the world works at all.
The Congressional Democrats' recently released "Small Business Index" (detailed in this 180KB PDF document) is a case study in smoke and mirror economics. But, you don't have to take my word for it - here's what small business and entrepreneurial expert Jeff Cornwall of Belmont University had to say on the nature of how Democratic representative in Congress are distorting the nation's current environment for small business people (emphasis mine):
The Democrats' SBI stands in stark contrast to other reports recently released, including one by the NFIB that shows a robust outlook for small business.
So why does the Democrats' SBI, once again, give a different picture than most other reports of its kind? The answer is in what they include in their index.
Many of the factors that they load into their index are macro economic variables that have never been shown to really have much a direct impact on small businesses, including balance of trade and federal deficits. While there may be legitimate reasons to be concerned about these types of measures, there is no evidence that they have any direct impact on small business start-ups or growth.
Other variables that they include are inconsequential or even meaningless for small business:
- They include the Russell 2000 index, which is a measure of stock prices of smaller public companies. The vast majority of small businesses employ fewer than 20 people and they are not publicly traded.
- They include venture capital activity. While this is an interesting factor for some discussions, VCs fund only a small fraction of one percent of businesses.
- They include a broad measure of commercial credit, rather than the more specific measure of small business credit reported by the SBA that most recently showed a 5.5% increase in bank funding of small business.
Probably the most important reason to be skeptical about the Democrats' SBI is what it does not measure. The cost/scope of regulation and tax rates have been proven in studies from around the world to be the two most important predictors of entrepreneurial activity. While the Democrats' SBI does include cost of regulations as one of their seventeen variables, they do not include a single measure related to taxes or tax rates.
Why don't the Democrats want to include tax rates in their index? Could it be that it does not fit their agenda? Who cares what really matters to small business and entrepreneurial economic development? This is politics!
Was there ever really any doubt of this final assessment?
By now, like most Americans, you're looking at your refrigerator full of Thanksgiving leftovers, and thinking to yourself: "If all I did was eat yesterday, how come I have so darned many leftovers, and what am I going to do with them?" Political Calculations(TM) can't help you with the first part of the question, but the second question provides today's lesson in home economics, where we seek to extend your personal budget by extracting the full value of what you spent on procuring and producing your Thanksgiving dinner.
The answer is actually provided Alton Brown of Food Network's Good Eats fame, who offered many suggestions in his show titled "The Remains of the Bird" in which he explored the possible solutions to this post-holiday problem (the episode originally aired in 2004.) The following recipes from the episode provide a taste of what to do with all those leftovers:
- In a Cranberry Jam
- Tart Cranberry Dipping Sauce
- Sweet Corn Bread Pudding
- Turkey Re-hash
- Bird to the Last Drop
Sadly, Food Network won't be airing this episode today, so this is the best we have to offer....
Labels: thanksgiving, turkey
In the middle of "a civil war of unequalled magnitude and severity," then-President Abraham Lincoln saw fit to proclaim Thanksgiving to be a national holiday. Here is the text of the proclamation:
October 3, 1863
The year that is drawing towards its close, has been filled with the blessings of fruitful fields and healthful skies. To these bounties, which are so constantly enjoyed that we are prone to forget the source from which they come, others have been added, which are of so extraordinary a nature, that they cannot fail to penetrate and soften even the heart which is habitually insensible to the ever watchful providence of Almighty God. In the midst of a civil war of unequalled magnitude and severity, which has sometimes seemed to foreign States to invite and to provoke their aggression, peace has been preserved with all nations, order has been maintained, the laws have been respected and obeyed, and harmony has prevailed everywhere except in the theatre of military conflict; while that theatre has been greatly contracted by the advancing armies and navies of the Union. Needful diversions of wealth and of strength from the fields of peaceful industry to the national defence, have not arrested the plough, the shuttle, or the ship; the axe had enlarged the borders of our settlements, and the mines, as well of iron and coal as of the precious metals, have yielded even more abundantly than heretofore. Population has steadily increased, notwithstanding the waste that has been made in the camp, the siege and the battle-field; and the country, rejoicing in the consciousness of augmented strength and vigor, is permitted to expect continuance of years, with large increase of freedom.
No human counsel hath devised nor hath any mortal hand worked out these great things. They are the gracious gifts of the Most High God, who, while dealing with us in anger for our sins, hath nevertheless remembered mercy.
It has seemed to me fit and proper that they should be solemnly, reverently and gratefully acknowledged as with one heart and voice by the whole American people. I do therefore invite my fellow citizens in every part of the United States, and also those who are at sea and those who are sojourning in foreign lands, to set apart and observe the last Thursday of November next, as a day of Thanksgiving and Praise to our beneficent Father who dwelleth in the Heavens. And I recommend to them that while offering up the ascriptions justly due to Him for such singular deliverances and blessings, they do also, with humble penitence for our national perverseness and disobedience, commend to his tender care all those who have become widows, orphans, mourners or sufferers in the lamentable civil strife in which we are unavoidably engaged, and fervently implore the interposition of the Almighty Hand to heal the wounds of the nation and to restore it as soon as may be consistent with the Divine purposes to the full enjoyment of peace, harmony, tranquillity and Union.
In testimony whereof, I have hereunto set my hand, and caused the seal of the United States to be affixed.
Done at the city of Washington, this third day of October, in the year of our Lord one thousand eight hundred and sixty-three, and of the independence of the United States the eighty-eighth.
A. Lincoln
Source: Classical Library
Political Calculations(TM) has gone deep into its archives to find recipes to go along with the grand traditional meal that is Thanksgiving. As it happens, the recipes were all taken from a cookbook prepared by Mrs. Geraghty's Kindergarten Class (I don't believe "Mrs. Geraghty" is related to the blogosphere's more well known Geraghty, but you never know....) All the same, here's what Mrs. Geraghty's kids have to say about how to fix up Thanksgiving dinner:
Thanksgiving dinner prepared by kids
A Thanksgiving Cookbook
by Mrs. Geraghty's Kindergarten ClassIvette - Banana Pie
You buy some bananas and crust. Then you mash them up and put them in the pie. Then you eat it.
Russell - Turkey
You cut the turkey up and put it in the oven for ten minutes and 300 degrees. You put gravy on it and eat it.
Geremy - Turkey
You buy the turkey and take the paper off. Then you put it in the refrigerator and take it back out and cut it with a knife and make sure all the wires are out and take out the neck and heart. Then you put it in a big pan and cook it for half an hour at 80 degrees. Then you invite people over and eat.
Andrew - Pizza
Buy some dough, some cheese and pepperoni. Then you cook it for 10 hours at 5 degrees. Then you eat it.
Shelby - Applesauce
Go to the store and buy some apples, and then you squish them up. Then you put them in a jar that says, "Applesauce". Then you eat it.
Meghan H. - Turkey
You cut it into 16 pieces and then you leave it in the oven for 15 minutes and 4 degrees. you take it out and let it cool and then after 5 minutes, then you eat it.
Danny - Turkey
You put some salt on it to make it taste good. Then you put it in the oven. Then you cook it for an hour at 5 degrees. Then you eat it.
Brandon - Turkey
First you buy it at Fred Meyer. Then you cut it up and cook it for 15 hours at 200 degrees. Then you take it out and eat it.
Megan K - Chicken
You put it in the oven for 25 minutes and 25 degrees and put gravy on it and eat it.
Christa - Cookies
Buy some dough and smash it and cut them out. Then put them in the oven for 2 hours at 100 degrees. Then take them out and dry them off. Then it's time to eat them.
Irene - Turkey
Put it on a plate and put it in the oven with gravy. You cook it for 1 minute and for 100 degrees. Then it's all cooked. Your mom or dad cuts it and then eat.
Moriah - Turkey
First you cut the bones out. Then you put it in the oven for 10 hours at 600 degrees. Then you put it on the table and eat it.
Vincent - Turkey
You cut and put sauce on it. Then you cook it for 18 minutes at 19 degrees. Then you eat it with stuffing.
Jordyn - Turkey
First you have to cut it up and put it on a plate in the oven for 9 minutes and 18 degrees. Then you dig it out of the oven and eat it.
Grace - Turkey
First you add some salt. Then you put it in a bowl. Then you put brown sugar on it. Then you mix it all together with a spoon and then you add some milk and mix it again. And then you put it in a pan. Then you put it in the oven for 15 minutes and 16 degrees. Then you take it out of the oven and then you eat it.
Alan - Turkey
First you shoot it and then you cut it. And then you put it in the oven and cook it for 10 minutes and 20 degrees. You put it on plates and then you eat it.
Jordan Salvatore - Turkey
First you put it in the oven for 15 minutes at 100 degrees. Then you cut it up and then you eat it.
Jordan Simons - Chocolate Pudding
Buy some chocolate pudding mix. Then you add the milk. Then you add the pudding mix. Then you stir it. Then you put it in the refrigerator and wait for it to get hard. Then you eat it.
Whitney - Turkey
Cut it and put it in the oven for 50 minutes at 60 degrees and then you eat it.
Jason - Chicken Pie
Put the chicken in the pot and put the salad and cheese and mustard and then you mix it all together. Then put chicken sauce and stir it all around again. Then you cook it for 5 minutes at 9 degrees. Then you eat it.
Christopher - Pumpkin Pie
First you buy a pumpkin and smash it. Then it is all done. And you cook it in the oven for 12 minutes and 4 degrees. Then you eat it.
Christine - Turkey
First you buy the turkey. Then you cook it for 5 hours and 5 degrees. Then you cut it up and you eat it.
Ashley - Chicken
Put it in the oven. Then cut it up. Then I eat it.
Jennie - Corn
My mom buys it. Then you throw it. Then you cook it. Then you eat it.
Jordan - Cranberry Pie
Put cranberry juice in it. Then you put berries in it. Then you put dough in it. Then you bake it. Then you eat it.
Adam - Pumpkin Pie
First you put pumpkin seeds in it. Put it in a pan and bake it at 5 degrees for 6 minutes. Then take it out and eat it.
Jarryd - Deer Jerky
Put it in the oven overnight at 20 degrees. Then you go hunting and bring it with you. Then you eat it.
Christina - Turkey
Get the turkey. Put it in the oven. Cook it for 43 minutes at 35 degrees. Put it on a plate, cut it up, then eat it.
Joplyn - Apple Pie
Take some apples, mash them up. Take some bread and make a pie with it. Get some dough and squish it. Shape the dough into a pie shape. Put the apples in it. Then bake it at 9 degrees for 15 minutes.
Isabelle - Spaghetti
Put those red things in it. Then put the spaghetti in it. Then cook it in the oven for 2 minutes at 8 degrees.
Bailey - Chicken
Put pepper and spices on it. Cook for one hour at 60 degrees. Then eat it.
Nicholas - White and Brown Pudding
First you read the wrapper. Get a piece of water. Stir. Then you eat it.
Sean - Turkey
Put it in the oven for 5 minutes at 55 degrees. Take it out and eat it.
Lauren - Turkey
First you find a turkey and kill it. Cut it open. Put it in a pan. Pour milk in the pan. Put a little chicken with it. Put salsa on it. Take out of pan. Put it on the board. Cut into little pieces. Put on a rack. Put in the oven for 7 minutes at 10 degrees. Take out of the oven and put eensy weensy bit of sugar on it. Put a little more salsa on it. Then you eat it.
Olivia - Corn
Get hot water and put on stove. Wait for 8 minutes. Put corn in. Then put it on a plate. Then eat.
Siera - Pumpkin Pie
Get some pumpkin and dough for the crust. Get pumpkin pie cinnamon. Cook it for 20 minutes at 10 degrees.
Kayla - Turkey
Buy it. Take it home. Then you cook it. Put it in the oven for 1 hour. Take it out of the oven. Put it on a plate. Then you eat it.
Tommy - Pumpkin
Cook the pumpkin. Then get ready to eat the pumpkin.
Wai - Pumpkin Pie
Get a pumpkin. Cook it. Eat it.
As a disclaimer, neither Mrs. Geraghty nor Political Calculations will be responsible for medical bills resulting from use of her class' cookbook.
Labels: thanksgiving, turkey
Looking for the latest turkey production numbers? See here!
What would any discussion of the Thanksgiving holiday be without the centerpiece of the celebration that it is built around: the turkey? In just looking at this one item in the period from 1989 through 2004, we can see the phenomenal growth of U.S. productivity – particularly in agriculture. We will begin by looking at the number of turkeys produced each year in the United States:
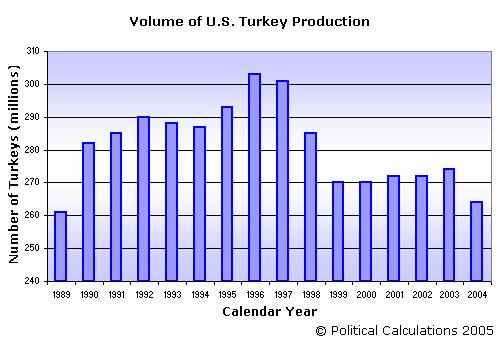
The chart above shows the change in the number of turkeys produced in the U.S. from 1989 through 2004. During that time, the number of turkeys grew from 261 million in 1989, peaked in 1996 at 303 million turkeys, and has dropped since back to 263 million turkeys in 2004. Now, you might think that the decline in the number of turkeys would mean that Americans are consuming less turkey, but that’s not necessarily the case. The next chart shows the production of turkeys in the U.S. by weight – with data for the turkeys Live Weight and Ready-To-Cook (RTC) Inspected Weight:
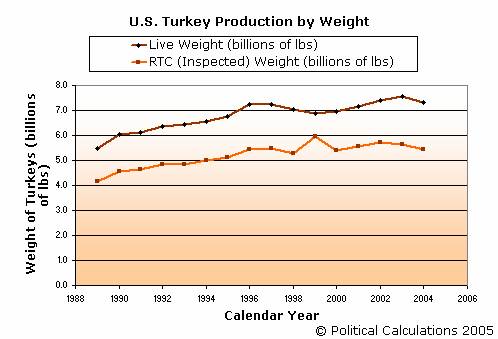
Aside from noting the spike in the RTC Inspected Weight in 1999, which is likely an error in the data source for these statistics, we see that the produced weight of U.S. turkeys has trended upward from 1989 through 2004. Going back to the turkey production volume data, we would expect to see that trend up to 1996-1997, followed by a drop as the number of turkeys produced in the U.S. has declined by 13%. Instead, we see that the weight of turkeys produced in the U.S. has continued to trend upward.
How is this possible? In a nutshell, it is because the U.S. turkey farmer has become dramatically more productive, raising fewer turkeys, but much larger ones! The following chart was generated using the data reported above and shows the average weight of the U.S. produced turkey from 1989 through 2004:
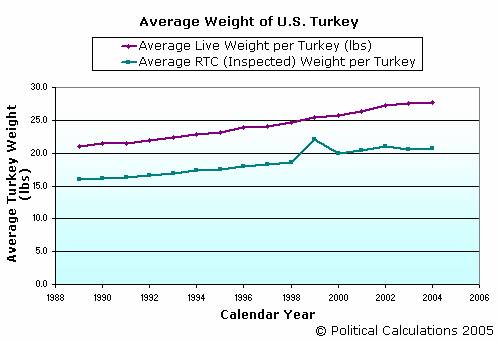
From 1989 through 2004, the weight of the average turkey has increased from 21.0 to 27.7 lbs (Live Weight) – an increase of 32.1%. Meanwhile, the RTC (Inspected) Weight has increased from 16.0 to 20.7 lbs – an increase of 29.2%.
So, there you go – the U.S. turkey farmer is remarkably more productive today than the turkey farmers of 16 years ago were. And for what it is worth, at least now you have something to say about turkeys around your Thanksgiving dinner table that doesn’t have anything to do with that substance in it that makes you sleepy!
Labels: thanksgiving, turkey
It so happened that we here at Political Calculations(TM) came to look at the calendar and noticed that this is a very short work week, so we made the executive editorial decision to bump our regular presentation of tools, economic, business and political commentary, plus some of the other stuff we do for the sake of making this a week-long celebration of the quintessential American holiday: Thanksgiving! All the things that we're really known for will be back in spades come next week!
In the meantime, we've mined the U.S. Census Bureau's press releases for Thanksgiving-related statistics, and we weren't disappointed! Without any further delay, here are the Thanksgiving 2005's numbers:
Weighing in With a Menu of Culinary Delights
256 million
The preliminary estimate of the number of turkeys raised in the United States in 2005. That's down 3 percent from 2004. The turkeys produced in 2004 weighed 7.3 billion pounds altogether and were valued at $3.1 billion. (Source: USDA National Agricultural Statistics Service)44.5 million
The preliminary estimate of the number of turkeys Minnesota expects to raise in 2005. The Gopher State is tops in turkey production. It is followed by North Carolina (36.0 million), Arkansas (29.0 million), Virginia (21.0 million), Missouri (20.5 million) and California (15.1 million). These six states together will probably account for about 65 percent of U. S. turkeys produced in 2005. (Source: USDA National Agricultural Statistics Service)
649 million pounds
The forecast for U.S. cranberry production in 2005, up 5 percent from 2004. Wisconsin is expected to lead all states in the production of cranberries, with 367 million pounds, followed by Massachusetts (170 million). Oregon, New Jersey and Washington are also expected to have substantial production, ranging from 18 million to 52 million pounds. (Source: USDA National Agricultural Statistics Service)1.6 billion pounds
The total weight of sweet potatoes - another popular Thanksgiving side dish - produced in the United States in 2004. North Carolina (688 million pounds) produced more sweet potatoes than any other state. It was followed by California (339 million pounds). Mississippi and Louisiana also produced large amounts: at least 200 million pounds each. (Source: USDA National Agricultural Statistics Service)998 million pounds
Total pumpkin production of major pumpkin-producing states in 2004. Illinois, with a production of 457 million pounds, led the country. Pumpkin patches in California, Ohio, Michigan, Pennsylvania and New York also produced a lot of pumpkins: each state produced at least 70 million pounds worth. The value of all the pumpkins produced by these states was about $100 million. (Source: USDA National Agricultural Statistics Service)2.1 billion bushels
The total volume of wheat - the essential ingredient of bread, rolls and pies - produced in the United States in 2005. Kansas and North Dakota - combined - accounted for about 33 percent of the nation's wheat production. (Source: USDA National Agricultural Statistics Service)$5.2 million
The value of U.S. imports of live turkeys during the first half of 2005 - all from Canada. Our northern neighbors also accounted for all of the cranberries the United States imported ($2.2 million). When it comes to sweet potatoes, however, the Dominican Republic was the source of most ($2.3 million) of total imports ($2.6 million). The United States ran a $1.7 million trade deficit in live turkeys over the period, but surpluses of $3.5 million in cranberries and $10.6 million in sweet potatoes. (Source: U.S. Census - Foreign Trade)13.7 pounds
The quantity of turkey consumed by the typical American in 2003 and, if tradition be true, a hearty helping of it was devoured at Thanksgiving time. On the other hand, per capita sweet potato consumption was 4.7 pounds. (From the upcoming Statistical Abstract of the United States: 2006)
The Turkey Industry
$3.6 billion
The value of turkeys shipped by the nation’s poultry processors in 2002. Those located in Arkansas led the way with $581.5 million in shipments, followed by processors in Virginia ($544.2 million) and North Carolina ($453.0 million). Businesses that primarily processed turkeys operated out of 35 establishments, employing about 17,000 people. (Source: U.S. Census)
The Price is Right
$1.00
Cost per pound of a frozen whole turkey in December 2004. (From the upcoming Statistical Abstract of the United States: 2006)
Where to Feast
3
Number of places in the United States named after the holiday's traditional main course. Turkey, Texas, was the most populous in 2004, with 496 residents; followed by Turkey Creek, La. (357); and Turkey, N.C. (267). There also are 16 townships around the country named "Turkey," three in Kansas.
Sources:
8
Number of places and townships in the United States that are named "Cranberry" or some spelling variation of the name we call the red, acidic berry (e.g., Cranbury, N.J.), a popular side dish at Thanksgiving. (Source: U.S. Census Factfinder)20
Number of places in the United States named Plymouth, as in "Plymouth Rock," legendary location of the first Thanksgiving. Plymouth, Minn., is the most populous, with 69,797 residents in 2004; Plymouth, Mass., had 54,604. Speaking of Plymouth Rock, there is just one township in the United States named "Pilgrim." Located in Dade County, Mo., its population was 135.
Sources:
107 million
Number of occupied housing units across the nation — all potential gathering places for people to celebrate the holiday. (Source: U.S. Census Housing Data)
Labels: thanksgiving, turkey
Every 10 years, the U.S. Census Bureau ventures out among the American public for the purpose of counting up just how many people there are running about the country. The changes in how the nation’s population is spread around the country drives changes in how the U.S. government operates – deciding things like how many representatives will come from each state as well as strongly influencing how federal tax dollars will be distributed.
The problem with the Census however, is that it’s only done every 10 years, and the accurate count of the U.S. population that the Census people put together is really only good for the year in which the Census is taken. For all the years between each Census, we have to make due with estimates of the total U.S. population.
Fortunately, the Census people provide estimates of the U.S. population as of July 1 for each year. Political Calculations has created a chart with data taken from the U.S. Census’ estimates of the total U.S. population from 1900 through 1999, as well as from 2000 through 2004.
In addition, Political Calculations has estimated the value for July 2005 (296,809,000) based on a simple projection of the Census Bureau’s estimated population figure for 2004, considering the average net change in the U.S. population as stated by the Census Bureau via the Population Clock. In the chart below, Political Calculations has also fit a trend line to the historic and estimated Census data, which suggests that the U.S. population is growing at an overall average annual rate of 1.26%:
The match between Political Calculations’ fitted curve and actual and estimated data appears to be pretty good overall, but the actual Census data suggest that the Census Bureau might be having some problems with its assumptions in how it determines its estimated population totals. Looking at the period of the late 1990s, the U.S. Census’ estimates of total U.S. population fall well short of where the trend line would indicate, and also where the actual Census count said it was in 2000.
This shortfall becomes clear when you look at the jump that occurred at the 2000 Census, where the 1999 estimated population of 272,690,813 increased by nearly 10 million to the mid-year total population estimate of 282,192,162 in 2000 (this amount has been adjusted to reflect the official results of the 2000 Census which has the actual population count as of April, 2000.) By comparison, the typical annual change in U.S. population in recent years is a year-over-year increase of roughly 2.5 million people, which show how large a discrepancy the difference between the Census Bureau’s estimates and the actual count were in 2000.
Never-the-less, it wouldn’t be Political Calculations if we didn’t offer a tool based on our curve-fitting exercise. The following tool may be used to estimate the total U.S. population at mid-year for any year from 1900 to 2050, assuming the rate of growth continues at 1.26% each year:
Based on current demographic trends, it is likely that Political Calculations’ population estimating tool is overstating the growth rate of the U.S. population, but my bet is that it’s close enough to the real figures to still be useful. We only have to wait until 2010 to find out for sure!
Where the Numbers Come From
- U.S. Census, U.S. Population for 7/1/2005 (Estimated by taking the 7/1/2004 estimated population and adjusting with net rate of change data provided via the U.S. Population Clock)
- U.S. Census, Total U.S. Population Estimates 2000-2004
- U.S. Census, U.S. Population Estimates 1900-1999
Labels: demographics, tool
Last week, Political Calculations began a series on the things medical professionals write up in their notes. This week's edition finds more excerpts from the patient's medical charts....
Healthy-appearing, decrepit 69 year old male, mentally alert but forgetful.
This patient is a mess of contradictions! Obviously, further tests are required....
The patient refused an autopsy.
Recalling last week's edition, we have to wonder if this is the same patient whose discharge status was "alive but without permission."
The patient has no past history of suicides.
Do you ever get the feeling that medical people get upset when having to deal with living patients?
The patient expired on the floor uneventfully.
Well, that solved *that* problem....
Patient has left his white blood cells at another hospital.
Right. And the dog ate his homework too.
Patient was becoming more demented with urinary frequency.
The patient was literally pissing away their sanity!
The patient's past medical history has been remarkably insignificant with only a 40 pound weight gain in the past three days.
Oh-my-gosh! They're retaining JELLO from the hospital cafeteria!
The patient experienced sudden onset of severe shortness of breath with a picture of acute pulmonary edema at home while having sex which gradually deteriorated in the emergency room.
Must have been quite embarrassed. Especially when they finally noticed all those doctors and nurses and orderlies watching....
Diagnosis: Claus-trophobia.
A terrible condition that gets worse every year when the stores set up their Christmas displays earlier and earlier.
Labels: health care, none really
Political Calculations has previously looked at the impact that having a bachelors or higher degree has upon one's lifelong earnings, but did you ever wonder what the best jobs available are for people who don’t have bachelor degrees?
Not long ago, Jobs for the Future, a non-profit "research, consulting and advocacy organization," published its view of "The Right Jobs" (free, e-mail address registration required), its study of U.S. labor statistics (published by the Bureau of Labor Statistics), in which it found the highest paying, highest demand occupations that did not require a college degree. Each of the professions listed qualified for the list by having an annual income of $25,000 or more, having a demand of at least 20,000 openings per year, and offering at least some chance of career advancement.
The list below is excerpted from a Knight-Ridder article by Banks Albach, and is presented using a dynamic table. You may click on any of the column headings to sort the table's data from lowest to highest or vice-versa according the heading selected:
| Best Jobs without Bachelor Degrees in 2005 |
|---|
| Profession | Income: Low End | Income: High End | Annual Job Openings | Minimum Education Requirement |
|---|---|---|---|---|
| Registered Nurse | 40000 | 57500 | 110119 | Associate degree in nursing. |
| Licensed practical nurse | 26400 | 37000 | 29480 | 11th grade math and reading. 12 month academic training program. |
| Customer Service Representative | 20960 | 33540 | 74137 | High school or college plus employer training. |
| Automotive Mechanic | 22080 | 41270 | 42542 | High school. 6 months to 2 years training, costing $3,000 to $24,000 USD. |
| Computer Support Specialist | 29760 | 51680 | 21579 | Entry level skills. Vocational school certifications and degrees. |
| Carpenter | 26180 | 45560 | 31917 | High school. 12 week pre-apprentice training and 3 to 4 year apprenticeship. |
| Electrician | 31100 | 55120 | 28485 | High school. 12 week pre-apprentice training and 3 to 4 year apprenticeship. |
| Plumber | 30540 | 53820 | 20511 | High school. 12 week pre-apprentice training and 3 to 4 year apprenticeship. |
| Commercial Truck Driver | 26020 | 41610 | 62517 | High school. 6 to 12 month training program. |
| Commercial Bus Driver | 21870 | 39510 | 25000 | High school. 6 to 12 month training program. |
Previously on Political Calculations
- Jobs and the Minimum Wage
- Your Education and Your Earnings
- Graduating to a Paycheck
- Free Economy, More Education, More Earnings
- Your Earnings: Education vs. Experience
- Education and Unemployment
- Growing Good Jobs
- Do You Have a Bad Job?
- The Highest Ranked "Good" Jobs
- The Young and Unemployed
- High Investment, Low Payoff Careers
- Do Government Programs Help Dislocated Workers?
It would have been unthinkable 10 years ago, and really unlikely just 5 years ago, but it appears that GM is on the verge of following its former Delphi division into bankruptcy.
While the responsibility for this now inevitable fate is shared by weak management, whose bad business decisions ultimately have led to this point, and extortive labor unions, who are primarily responsible for shaping the company's luxurious worker benefit provisions that sealed the company's fate, what happens next at GM will be a bellweather for other ossified non-competitive U.S. industries, with the impact sure to influence public policy decisions for decades to come.
What's the impact? When you consider the thousands and thousands of employees of General Motors, past and present, bankruptcy for GM will affect their very generous health care plans, pensions and other worker benefit programs, with much of the slack very possibly being taken up by the U.S. taxpayer - much as recent bankruptcies in the airline industry has demonstrated. The only problem with this outcome is that these benefits will be provided at a much lower level than had been promised - a fate that could have been avoided if GM and its unions had tranfered the ownership of these plans from the company and the unions to the individual employees through 401(k)-type retirement saving plans and personal health savings accounts.
The immediate questions for the auto industry may well affect how the business will be structured. Will the domestic U.S. auto industry adopt bankruptcy as part of its business model much like the perpetually-troubled U.S. airline industry has (another industry noted for its lousy management and greedy unions)? Is there a domestic automaking equivalent to Southwest Airlines that can point the way to sustainable success? Or have the foreign-based automakers who have already located major production facilities here the only hope for the future of automobile production in the U.S.?
The final question is one that will be answered by historians: Why did GM's stakeholders (its management, unions, employees, shareholders and local, state and national government entities) ever let it get this bad?
In economics, the choice by a consumer to select one product over another when one becomes cheaper relative to its alternative is known as the substitution effect.
One example of this effect is happening now in the desert southwest, where the combination of high oil prices with the substitution effect may provide an entrepreneurial company with the demand needed to significantly grow its business: making natural liquid rubber from the bark of the guayule (pronounced "why-you-lee") plant.
As reported by the Arizona Republic, the opportunity provided by higher oil prices, which has increased the cost of manufacturing synthetic rubber, has allowed the Yulex company to attract $8 million USD in venture capital to expand its business, at a time when the cost of the company's product has become very competitive with the cost of the synthetic version derived from oil.
Funny how when prices go up, there suddenly turns out be a lot more supply of things than anybody previously thought! Somehow, the conventional wisdom never accounts for the entrepreneur or for innovation.
Labels: economics
Do you keep track of the individual share prices of the various investments in your portfolio? Do you know how much a change in the price per share of stock that you own will change the total value of your investment?
Only you can answer the first question, but Political Calculations(TM) is here to help you answer the second one. The following tool may be used to quickly determine the change in the total value of your investment given the number of shares you own and the change in the price per share of your stock.
Enter the appropriate data in the table below, and click "Calculate" for your results (to track a negative change, enter the price per share or change in value amount as a negative number):
Please note that the change in value calculated above is a raw value that does not take any commissions, charges or fees into account that may reduce your actual return from your investment into account.
But wait a minute! What if you want to see what to do the math this tool does in reverse? Well, we can do that too! Enter the number of shares and the change in the total value of the stock you own in the table below, and we'll figure out the change in the price per share that goes along with it:
Did you ever wonder what the doctors and nurses were writing in those patient charts? Political Calculations has the inside story from the hospital's candystripers, who fortunately, could decipher the doctor's scribblings....
By the time he was admitted, his rapid heart had stopped and he was feeling better.
The expression "time heals all wounds" goes a long way to explaining why the wait times at emergency rooms are so long....
Patient has chest pain if she lies on her left side for over a year.
I guess I would too....
On the second day the knee was better and on the third day it had completely disappeared.
Hospital security still has no leads.
She has had no rigors or shaking chills, but her husband states she was very hot in bed last night.
No comment....
The patient has been depressed ever since she began seeing me in 1983.
This is exactly why it sucks being a psychologist.
I will be happy to go into her GI system, she seems ready and anxious.
She said it beats seeing the psychologist again....
Patient was released to outpatient department without dressing.
Budget cuts evidently led to the hospital's phasing out of those gowns that don't close in the back.
The patient is tearful and crying constantly. She also appears to be depressed.
The psychologist. Practicing since 1983.
Discharge status: Alive but without permission.
Naughty, naughty patients. Thinking they run out and live without authorization from the doctor....
The patient will need disposition, and therefore we will get Dr. Ward to dispose of him.
From what I understand, Dr. Ward is usually called in when the psychologist needs help too.
Labels: health care, none really
On the whole, Political Calculations' prototype election outcome prediction tools did well, although some minor reprogramming will be in order to make them more useful for playing the "how will the votes have to break" election night game! Here's the election night wrap-up:
Virginia Governor
In the end, this race turned out to not be anywhere near as close as the average of polls in the days preceding the election indicated it might be. Tim Kaine won a convincing majority of the vote with 1,021,914 votes, with Jerry Kilgore winning just 911,861 votes and Russ Potts an embarrassingly low 43,884 votes. On a personal note, I really have to compliment Virginia's Department of Elections, who's real-time online reporting of the state's election results is simply the best I've seen anywhere.
New Jersey Governor
John Corzine, as expected, has won a clear majority of the vote, collecting 879,388 votes to Doug Forrester's 711,186 votes. Given that these two candidates spent an estimated $70,000,000 between them for the privilege of being able to sleep in New Jersey's governor's mansion, each vote cast (at this point) in this election is worth approximately $44.01!
King County (WA) Executive
With 2550 of 2573 precincts now reporting, Ron Sims has taken a large lead of 163,256 votes over David Irons 119,648 votes in the election night vote count. Political Calculations prediction tool for the King County Executive race has been adjusted to take these latest figures into account. It will still be several days before the race will be finalized, although at this point, supporters of reform in King County have to be disappointed, as David Irons needs to win roughly 56.7% of the estimated number of remaining uncounted ballots to win, assuming a 60% turnout.
Update: A much lower than expected turnout in King County has sharply decreased the likelihood that Irons will win, and he has conceded the race.
Washington State I-912 (Fuel Tax Rollback)
Political Calculations prediction tool for I-912 has been updated to show the results for all 39 counties, with 581,159 votes against rolling back the state's fuel tax and 517,899 votes in favor. The count is still a long way from being over, as a large number of absentee ballots will need to be counted over the next several days. Assuming a voter turnout of 60%, the measure will need 53.2% of the estimated remaining uncounted ballots to pass.
Update: Much lower than predicted turnout and strong opposition in Washington's urban areas will result in the likely failure of I-912 to pass. For Washington state drivers, Political Calculations offers a tool that allows you to estimate how much you'll pay annually in fuel taxes.
The 2005 special election in Washington state features the biggest anti-tax measure on any ballot anywhere in the nation this time around, as the voter's initiative I-912 would seek to repeal the largest fuel tax rate hike ever imposed in the state's history.
This race is also remarkable in that a Washington state judge has issued a ruling that talk-radio advocacy on the behalf of a political position represent "in-kind" contributions to political campaigns. The effect of the ruling has been to silence support in favor of repealing the state's fuel tax increases.
The tool below is designed to help you determine how the votes cast will have to break to decide the election on this issue one way or another. That being the case, you are more than welcome update the numbers yourself with the latest available election returns posted by the Washington state Secretary of State's office, should you find our already entered figures to be in need of updating. The initial default number for uncounted absentee ballots is the number of registered voters in Washington in 2004.
Update 8 November 2005, 8:30 PM PST: The initial returns released by the Washington Secretary of State's Office for I-912 show results for 16 of 39 counties, with 155,414 votes in favor of repealing the state's recent gas tax increase and 132,747 votes against. Assuming that the Secretary of State's prediction that the turnout for the statewide election would be 60% holds true, the number of uncounted ballots has been adjusted to reflect this figure, as well as reduced by the number of already counted ballots. The final results may take a number of days to determine given the state's large percentage of absentee ballots.
Update 8 November 2005, 9:00 PM PST: The tables below have been changed to reflect the results for 30 of 39 counties, with 339,199 votes in favor of repealing the gas tax and 350,395 votes opposed.
Update 9 November 2005, 5:30 AM PST: The tables have been updated to show the results for all 39 counties, with 581,159 votes against rolling back the state's fuel tax and 517,899 votes in favor. The count is still a long way from being over, as a large number of absentee ballots will need to be counted over the next several days.
How to Interpret the Results
If the "Needed to Pass" or "Needed to Fail" percentage is negative, it means that the indicated measure can actually have votes taken away from its total and still be able to win a simple majority of votes cast in the election. In other words, the presence of a negative value indicates which position has won.
If a position has a percentage that is greater than 100%, it means the measure cannot win a clear majority of the vote, although it may be possible to win a plurality of the votes cast.
If the measure has percentages that are greater than 0% but less than 100%, the race is up for grabs. Polling data for the areas where votes have still not been fully tallied may be used to anticipate who will likely win the most votes.
The position with the highest percentage needed to win is the least likely to do so.
While not a perfect tool, Political Calculations' Simple Majority Calculator does offer some insight into how the uncounted vote totals in an election have to break in order for a given measure to pass or fail.
Following on the heels of extreme election irregularities in the 2004 governor's race, Washington state's King County Executive race is expected to provide ample opportunity to display what, if any, improvement has been made to the County's Elections department by its demonstratedly inept and potentially corrupt leadership. With the race between reformer David Irons and incumbent Ron Sims shaping up to be relatively close, this is definitely a race to watch.
The following tool is designed to help predict the winner of the election after the vote count has begun. What it does is really simple - it starts with the votes that have already been counted for the given candidates, then it adds those numbers to the total number of estimated votes cast that are still uncounted. It next determines how many votes it will take for a candidate to win a clear, simple majority, as well as what percentage of the uncounted votes a candidate would have to receive in order to win.
What the tool does not do is address voting discrepancies, such as mismatched counts of ballots and voters, which Ron Sims' appointed Director of Elections Dean Logan has consistently failed to rectify since the problem exploded during his tenure, making the King County Elections office the third-worst in the U.S. But, that's a topic far more definitively covered by Sound Politics' Stefan Sharkansky.
The data in this table will be updated periodically in the days following the election. The initial default values are those posted by King County as of November 3, 2005. If you find that the data is not up-to-date, you're welcome to do it yourself - assuming competence, King County's election results should be available through their site.
Update 8 November 2005, 8:30 PM PST: With just 14.73% of the ballots counted for the 1,015,738 registered voters of King County, incumbent Ron Sims leads reformer David Irons 74,497 to 62,906. The figures in the table below have been adjusted to reflect these figures, with the values entered for the number of uncounted "other" ballots adjusted to take Secretary of State Sam Reed's prediction of a 60% turnout into account, as well as reducing this figure by the number of votes already counted. Since a large number of ballots have been cast absentee, it will be several days before the tabulated returns will provide enough data to truly predict the outcome.
Update 9 November 2005, 5:30 AM PST: With 2550 of 2573 precincts now reporting, Ron Sims has taken a large lead of 163,256 votes over David Irons 119,648 votes in the election night vote count. The tool below has been adjusted to take these latest figures into account. It will still be several days before the race will be finalized, although at this point, supporters of reform in King County have to be disappointed.
How to Interpret the Results
If a candidate has a negative percentage, it means that they can actually have votes taken away from their totals and still be able to win a simple majority in the election. In other words, they have won a solid majority and are the clear winner.
If a candidate has a percentage that is greater than 100%, it means they cannot win a clear majority of the vote, although it may be possible to win a plurality of the votes cast.
If the candidates have percentages that are greater than 0% but less than 100%, the race is up for grabs. Polling data for the areas where votes have still not been fully tallied may be used to anticipate who will likely win the most votes.
The candidate with the highest percentage needed to win is the least likely to do so.
While not a perfect tool, Political Calculations' Simple Majority Calculator does offer some insight into how the uncounted vote totals in an election have to break in order for a given candidate to win office.
It's just a two candidate race for governor in New Jersey, with current U.S. Senator John Corzine (D) polling well ahead of opponent Doug Forrester (R) in the days ahead of the election. What makes this race remarkable is that both candidates have largely self-funded their campaigns, spending millions of dollars for the privilege of occupying the state's governor's mansion.
The following tool is designed to help predict the winner of the election after the actual vote count has begun. What it does is really simple - it starts with the votes that have already been counted for the given candidates, then it adds those numbers to the total number of estimated votes cast that are still uncounted. It next determines how many votes it will take for a candidate to win a clear, simple majority, as well as what percentage of the uncounted votes a candidate would have to receive in order to win.
The data in this table will be updated periodically in the days following the election. The initial default values represent the total number of registered voters in New Jersey (the 4,832,825 in the "other" category), while the other categories have been set to zero since no information is yet available for them. All data is as of November 1, 2005.
If you find that the numbers below are not up-to-date, you can obtain the latest election results through New Jersey's Division of Elections web site.
Update 8 November 2005, 11:30 PM EST: Per New Jersey's initial unofficial results, Corzine has won 490,025 votes to Forrester's 413,550, although with no reporting from nine counties. Assuming New Jersey has a similar turnout to Virginia, the remaining uncounted votes in the table below reflect 45% of the number of the state's registered voters, reduced by the number of votes already counted.
Update 9 November 2005, 8:30 AM EST: John Corzine has won a clear majority of the vote, collecting 879,388 votes to Doug Forrester's 711,186 votes. Given that these two candidates spent an estimated $70,000,000 between them for the privilege of being able to sleep in New Jersey's governor's mansion, each vote cast (at this point) cost each candidate approximately $44.01! The tool below has been adjusted to reflect the vote count figures, and the estimate of total turnout has been reduced to 35% (pending the election's final returns.)
How to Interpret the Results
If a candidate has a negative percentage, it means that they can actually have votes taken away from their totals and still be able to win a simple majority in the election. In other words, they have won a solid majority and are the clear winner.
If a candidate has a percentage that is greater than 100%, it means they cannot win a clear majority of the vote, although it may be possible to win a plurality of the votes cast.
If the candidates have percentages that are greater than 0% but less than 100%, the race is up for grabs. Polling data for the areas where votes have still not been fully tallied may be used to anticipate who will likely win the most votes.
The candidate with the highest percentage needed to win is the least likely to do so.
While not a perfect tool, Political Calculations' Simple Majority Calculator does offer some insight into how the uncounted vote totals in an election have to break in order for a given candidate to win office.
Virginia offers one of the more interesting elections this year, featuring a potentially close race between major party candidates Jerry Kilgore (R) and Tim Kaine (D) for governor, along with a potential spoiler in third-party candidate Russ Potts (I). For the latest in election news and polling data, RealClearPolitics.com offers the best single-stop source on the web for this race.
The following tool is designed to help predict the winner of the election after the vote count has begun. What it does is really simple - it starts with the votes that have already been counted for the given candidates, then it adds those numbers to the total number of estimated votes cast that are still uncounted. It next determines how many votes it will take for a candidate to win a clear, simple majority, as well as what percentage of the uncounted votes a candidate would have to receive in order to win.
The data in this table will be updated periodically in the days following the election. The initial default values represent the total number of registered active voters (the 4,227,894 in the "other" category), the number of inactive voters (the 219,590 in the "provisional" category) and the number of overseas voters (the 2,626 in the "absentee" category) as of November 1, 2005.
If the tool doesn't have the most up-to-date numbers, you're more than welcome to update it yourself with the latest figures put out on the Commonwealth of Virginia's elections results site!
Update 8 Nov 2005, 7:30 PM EST: 130 of 2426 precincts reporting. Kaine (64,387) leading Kilgore (63,335) and Potts (1,997). Figures unavailable for absentee and provisional ballots, "other" taken as 50% of total registered voters reduced by ballots already counted.
Update 8 Nov 2005, 8:27 PM EST: 1348 of 2426 precincts reporting. Kaine (549,457) leading Kilgore (499,922) and Potts (23,157). Figures unavailable for absentee and provisional ballots, "other" taken as 50% of total registered voters reduced by ballots already counted.
Update 8 Nov 2005, 11:12 PM EST: 2375 of 2426 precincts reporting. Kaine (989,755) leading Kilgore (884,211) and Potts (41,895). Figures unavailable for absentee and provisional ballots, "other" taken as 44% of total registered voters reduced by ballots already counted. It would seem that Tim Kaine has won a clear majority.
Update 9 Nov 2005, 8:30 AM EST: In the end, this race turned out to not be anywhere near as close as the average of polls in the days preceding the election indicated it might be. Tim Kaine won a convincing majority of the vote with 1,971,284 votes, with Jerry Kilgore winning just 907,212 votes and Russ Potts an embarrassingly low 42,919 votes. On a personal note, I really have to compliment Virginia's Department of Elections, who's real-time online reporting of the state's election results is simply the best I've seen anywhere.
How to Interpret the Results
If a candidate has a negative percentage, it means that they can actually have votes taken away from their totals and still be able to win a simple majority in the election. In other words, they have won a solid majority and are the clear winner.
If a candidate has a percentage that is greater than 100%, it means they cannot win a clear majority of the vote, although it may be possible to win a plurality of the votes cast.
If the candidates have percentages that are greater than 0% but less than 100%, the race is up for grabs. Polling data for the areas where votes have still not been fully tallied may be used to anticipate who will likely win the most votes.
The candidate with the highest percentage needed to win is the least likely to do so.
While not a perfect tool, Political Calculations' Simple Majority Calculator does offer some insight into how the uncounted vote totals in an election have to break in order for a given candidate to win office.
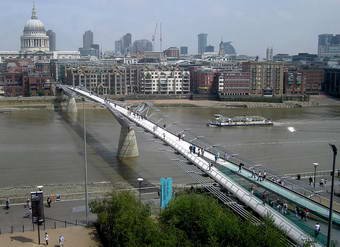 The post-mortem study of the failure of London's Millennium Bridge is in, and sadly, the report does a real disservice to the engineering profession in assessing responsibility for the design's inherent instability. From the Reuters' article "Revealed: Why London’s Millennium Bridge wobbled":
A natural phenomenon rather than a design fault caused London's Millennium Bridge to wobble and sway, forcing its closure just two days after opening in 2000.
The elegant pedestrian walkway was conceived as a blade of light linking the south bank of the River Thames to the City of London.
But as large crowds walked across the steel structure on opening day in June 2000, the 320-meter long bridge swayed from side to side because of a phenomenon known as collective synchronization.
"The phenomenon was that people who were walking at random, at their own favorite speed, not organized in any way spontaneously synchronized," said Steven Strogatz, of Cornell University in Ithaca, New York.
"That's the phenomenon. Why did they all start moving in step? They did it unconsciously. That is what nobody had thought about and engineers did not anticipate."
It would seem from Strogatz' comments that some ancient engineering knowledge has managed to slip past the bridge's designers without being absorbed. By ancient, I mean at least the Romans, whose armies over 2000 years ago would be given the order to "break step" before crossing a bridge. How Stuff Works explains why:
This is to avoid the possibility that their rhythmic marching will start resonating throughout the bridge. An army that is large enough and marching at the right cadence could start a bridge swaying and undulating until it broke apart.
Today, most civil engineers will design bridges to reduce the potential for the occurrence of the resonance effect, including designing the bridge to have a natural frequency (at which resonance can occur) significantly higher than what will be imparted to the bridge through use, or using other strategies for dampening the vibrations that are created.
The Reuters article describes how the effect propagated in the Millennium Bridge:
Certain coincidences must occur for collective synchronization to occur. In the case of London's wobbly bridge, it was large crowds walking across a flexible footbridge that vibrated at a frequency of one cycle per second, which just happened to be the same frequency as humans walking.
So, there it is – an inherent design flaw. Designed to have a natural frequency very close to that of a walking person, all that was needed was a feedback mechanism to produce the resonance effect. To this end, the bridge's motion was such that it sent feedback to every individual walking upon it to effectively "synchronize" their step, making them, without any other outside coordination, into a marching army – thereby amplifying the effect.
After two days of this activity, the authorities closed the bridge until repairs could be made. The bridge has since reopened with considerable reinforcement, both designed to increase the bridge's natural frequency well above that of a walking army, as well as incorporating damping technologies to prevent vibrations from spreading as they had before.
The bottom line – the bridge was poorly designed. No "natural causes" need apply....
Update 7 November 2005: The image of the London Millennium Bridge has been corrected - thanks to commenter Gareth Rees for identifying our error (we had incorrectly included an image of the Gatehead Millennium Bridge.)
Labels: technology
 Are you one of those people who have invested in an exercise machine? Sure, there are treadmills, home weight machines, stair-climbers, rowing machines, cross-country ski machines, and dozens of others, but do they give you the out-of-the-world workout you're truly looking for?
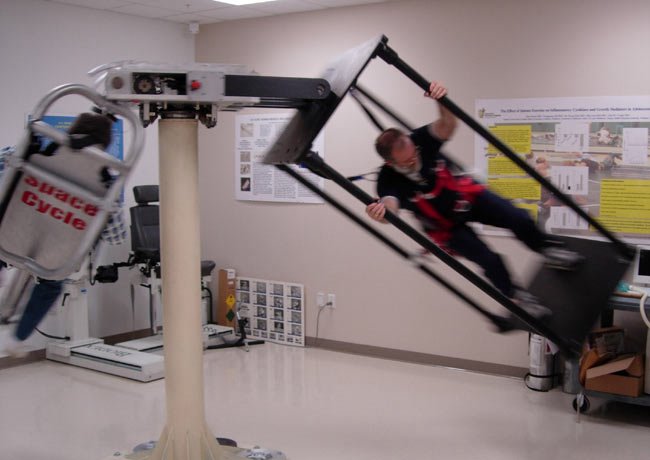
According to Space.com, researchers at the University of California-Irvine and the National Space Biomedical Research Institute (NSBRI) have invented a two-person centrifuge-style workout machine, the Space Cycle:
Imagine a two-person, hanging merry-go-round. A spinning wheel sits on top of a thick steel pole. On one side of the wheel hangs a recumbent bicycle. Opposite the bike is a cage-like platform. One person sits on the bicycle while the other stands on the platform.
As the bicycle rider pedals, the merry-go-round begins to spin, causing both the bicycle and the platform to spin around the pole. As the merry-go-round spins faster and faster, both the bicycle rider and the person on the platform begin to feel the effects of artificial gravity caused by the momentum of the device.
The person on the platform can now perform squat exercises at gravity equal or greater – the researchers have produced artificial gravity seven times that of Earth – to what they would experience on Earth.
While designed to combat the loss of bone and muscle tissue that comes from prolonged exposure in the low-gravity environment of space, I wouldn't be surprised at all to see a commercial version of this device show up in gyms across the U.S. The strength training possible in the hyper-gravity environment generated by the Space Cycle would be reason enough for athletic departments and professional sport teams to invest in the technology. In a world where competitive sports drive top athletes to seek every possible edge, there certainly would be a huge market for it.
Labels: none really, technology
Welcome to the blogosphere's toolchest! Here, unlike other blogs dedicated to analyzing current events, we create easy-to-use, simple tools to do the math related to them so you can get in on the action too! If you would like to learn more about these tools, or if you would like to contribute ideas to develop for this blog, please e-mail us at:
ironman at politicalcalculations
Thanks in advance!
Closing values for previous trading day.
This site is primarily powered by:
CSS Validation

RSS Site Feed
JavaScript
The tools on this site are built using JavaScript. If you would like to learn more, one of the best free resources on the web is available at W3Schools.com.
Other Cool Resources
Blog Roll


