Welcome to the March 31, 2006 edition of the only mini-Carnival dedicated to highlighting the best posts contributed to the major business, economics and personal finance related blog carnivals! We're trying out a new static table-based format this week (although not a dynamic table, since the contents aren't really rankable!) But enough technical talk - here are the best posts of the week!
| Best Posts of the Week | |||
|---|---|---|---|
| Carnival | Contributor | Post | Comment |
| Carnival of Personal Finance | Single Guy High Impact Saving | High Impact Savings My Way | Can you join a gym and reduce your net spending at the same time? The Single Guy shows how he's doing it! |
| Carnival of Personal Finance | MightyBargainHunter | High Impact Savings My Way | Looking for ideas on what to do with your tax refund this year? The MightyBargainHunter points to seven good ideas from Liz Pulliam Weston. |
| Carnival of the Capitalists | BusinessPundit | The Wisdom of Niches: Why Experts Still Matter | Rob May finds where the wisdom of crowds isn't as good as the knowledge of experts in business. |
| Carnival of the Capitalists | Bona tempora volvantur | The Art of Sucking Down | When confronted by the difficult personalities that pass for celebrities these days, lots of otherwise rational people suck up to them for the sake of advancing their business. Guy Kawasaki argues that the ability to "suck down" to people who don't have "A-list" credentials, but are responsible for making things happen, is more important to one's success. |
| Carnival of the Capitalists | Photon Courier | The Story of a Software Failure | What can be learned from the "greatest debacle in the history of organized work?" |
| Festival of Frugality | Frugal Upstate | What Does Frugal Look Like? | Have you ever compared the popular image of frugal people versus the reality? Jenn from Upstate New York writes a self-portrait. |
| Carnival of Investing | Growth in Value | Stellar Performance | A large percentage of this week's Carnival of Investing was very technical (and worth reading if you're looking for investing ideas), but GIV's post on an astrology-based fund was too good to pass up including in this week's edition! |
| Carnival of Investing | Frugal Wisdom from Wenchypoo's Warehouse | Let's Play the Bird Flu Strategy Game | The spread of the bird flu virus across the globe has lots of people scrambling for many things (cures, quarantine plans, etc.) Heidi Mapp argues that the stocks of publicly-traded meat producers should be on the list too! |
| Carnival of Debt Reduction | Frugal Wisdom from Wenchypoo's Warehouse | Personal Finance Debt Videos | In what I'm sure will be a growing trend in blogging, Jeffrey Strain makes good use of video clips to comment on how debt reduction reduces stress that many people don't realize they have. |
| Carnival of Entrepreneurship | Escape from Cubicle Nation | Three ways to take the fear of failing head on | Is fear a barrier to your becoming an entrepreneur? Pamela Sim offers three suggestions for how to cope with a potentially crippling case of fear in The Best Post of the Week, Anywhere(TM)! |
Recently, the news that a settlement was pending in a series of class-action lawsuits filed against the Nortel Networks (NYSE: NT) by its shareholders, as the company indicated that it would:
- Pay shareholders $575 million in cash, and
- Issue 628.7 million new shares of its stock (about 14.5% of the amount of stock currently issued) worth nearly $1.9 billion.
Altogether, the company would pay nearly $2.5 billion USD for the purpose of putting a massive accounting scandal that had taken place under the watch of previous management behind it.
Sounds like a huge payout for the shareholders who filed the suit, right?
Well, maybe not. Yahoo! Finance's NT message board poster abcsofhealth did some math:
All the shareholders of record; 4.33 bil get and equal cut of the TOTAL payout ~ 2.7 bil.
That translates to APPROX. $.62 PER SHARE. Oh, Better deduct the APPROX. 27 % lawyer payout first , that brings it down to APPROX. $.46 PER SHARE.
Oh, better factor in the 14.5 % dilution factor. Lets see with NT at approx. $3.00 per share IF THE MKT deducts this; THATS APPROX. $.44.
Lets see WHATS LEFT; $.46 - $.44 = $.02 per share.
LETS SUM IT UP:
THE LAWYERS GET RICH
THE TEACHERS FUND MANAGER GETS A LARGE RAISE
THE COMPANY IS DAMAGED
and the shareholders are lucky to get TWO CENTS.
But that's not the best part of abcsofhealth's commentary. Continuing...
These type of lawsuits are NOT in the shareholders interest NO MATTER HOW YOU BREAK IT DOWN.
PS. If shareholders own the company; the MORONS sued themselves AND OF COURSE lost. IF THERE WAS NO SUIT; NT WOULD BE A COUPLE OF BUCKS HIGHER AND IN A STRONGER POSITION GOING FORWARD.
Gotta give credit to the lawyers and upper fund managers that convinced these IDIOTS to file a lawsuit. I can just see it;
THIS ISN'T RIGHT we got to get that NT, the lawyers stated and the morons rise up in ANGER, ya get them nogoods. Later the lawyer meets with his buddie the fund manager and laughs his butt off at the sheer stupidity before going to the bank of course with his retainer.
Gosh! Almost sounds like politics (only the names of the rent-seeking parties have been changed....)
Christopher Wheeler has an interesting article (available as a 149KB PDF document) in the March/April 2006 edition of the of the Federal Reserve Bank of St. Louis' Review, which looks at the growth in the numbers of the college-educated in major metropolitan areas.
Aside from finding that larger, more-educated metropolitican areas are experiencing a faster rate of increase in the number of the college-educated than smaller, less-educated metropolitan areas, Wheeler has also documented trends in what industries are accumulating workers with at least bachelor degrees from 1980 through 2000. The following table is taken from Wheeler's Table 4 "College Attainment by Major Industry", with only difference being that the decimal values Wheeler presented have been converted into percentages. I've also added a new column indicating the percentage change in the representation of the college-educated hired in each industry from 1980 to 2000.
Finally, the data below is presented in a dynamic table. You may sort the data from low to high or from high to low for each category listed just by clicking the column headings:
| College Attainment by Major Industry Percentage of Each Industry's Total Employment with a Bachelor's Degree or Higher |
|---|
| Industry | 1980 | 1990 | 2000 | Pct. Change 1980-2000 |
|---|---|---|---|---|
| Agriculture, forestry, fisheries | 15.4 | 16.0 | 15.4 | +00.0 |
| Mining | 13.8 | 17.9 | 14.1 | +00.3 |
| Construction | 7.2 | 9.4 | 8.9 | +01.7 |
| Nondurable manufacturing | 11.2 | 15.3 | 19.6 | +08.4 |
| Durable manufacturing | 11.1 | 15.8 | 18.3 | +07.2 |
| Transportation | 9.0 | 12.3 | 14.4 | +05.4 |
| Communications | 14.6 | 23.1 | 32.8 | +18.2 |
| Utilities | 12.3 | 18.1 | 19.4 | +07.1 |
| Wholesale trade | 15.2 | 19.9 | 21.2 | +06.0 |
| Retail trade | 9.2 | 11.6 | 13.6 | +04.4 |
| Finance, insurance, real estate | 22.7 | 30.6 | 36.4 | +13.7 |
| Business and repair services | 20.0 | 25.5 | 33.0 | +13.0 |
| Private household services | 3.3 | 5.2 | 6.8 | +03.5 |
| Personal services | 6.7 | 10.5 | 12.0 | +05.3 |
| Entertainment and recreation services | 19.4 | 22.6 | 25.9 | +06.5 |
| Medical services | 21.9 | 28.9 | 33.0 | +11.1 |
| Educational services | 54.6 | 55.0 | 56.2 | +01.6 |
| Social services | 35.9 | 41.0 | 46.7 | +10.8 |
| Other professional services | 46.7 | 53.0 | 53.7 | +07.0 |
| Public administration | 25.2 | 29.8 | 35.2 | +10.0 |
Why the Changes?
The table above may only be telling part of the story with respect to where the large increases in the college educated in many of the industries listed are being derived. Here is what we suspect the driving factors behind the changes to be:
New hire screening: For the large increases in the college-degreed among many of the total industry populations to have occurred between 1980 and 2000, an even larger percentage of the population being hired into these industries must be coming in with college degrees. This would suggest that these industries have increased the amount of the screening they do of their respective new hire pools to prefer the college-educated.
Converting existing employees: A large volume of people already working in each industry may have pursued and earned college degrees in the time since their original hiring, thereby converting them from the numbers of the undegreed to the ranks of the college-educated captured in the table's data.
Outsourcing and competition: Given the changes in the U.S. economy over the years from 1980 to 2000, many jobs being done that did not require college degrees may have been transferred out of the United States, either directly by the businesses within the industries through outsourcing or indirectly by business failures in the various industries spurred by foreign-based competition.
The bottom line? If you're looking to get work in the U.S., that college degree is becoming more and more important.
Every now and again, we come across a new (to us) utility on the web that changes how we look at things. Worldmapper does that quite literally with cartograms! The site is dedicated to producing maps of the nations of the world, where the size of each nation is presented to be in proportion to an area of interest, such as population, tourism, etc. (HT: Mahalanobis).
Because we couldn't resist, here's a quick walkthrough of some of the maps available through Worldmapper:
The World as We Best Know It
The most familiar cartogram is one that shows the distribution of land area by nation - in other words, a world map!":

Where the People Are
The total population cartogram emphasizes the nations where the greatest number of people live in the world:

Where People Want to Live
The following cartogram emphasizes the nations having the greatest inflow of immigrants. The United States receives 37.1% of the net total for the world!:
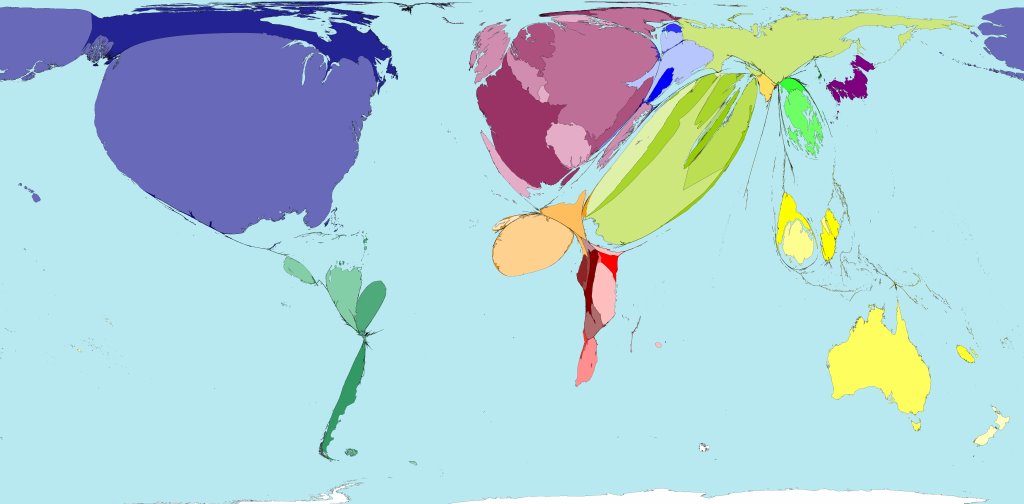
Where People Are Moving From
This cartogram emphasizes the nations that have the greatest net emigration. Current world champion: Mexico:

Where People Only Want to Visit
By far, the nations of Western Europe top the list of the world's preferred tourist destinations:

Where People Are Being Forced Out
The cartogram below illustrates the nations that are producing the greatest number of refugees:

This week, we're finally recognizing some patterns as to who is producing some of the best commentary around the business end of the blogosphere in this week's edition - be ready to update your bookmarks!
Carnival of the Capitalists
The CotC is hosted this week by Casey Software.
- Hierarchy and GM
Professor Stephgn Bainbridge looks at GM's economic problems and finds that perhaps its biggest problems are those that revolve around its culture. Essential reading for anyone who doesn't understand what it takes to turn around a struggling business with deeply rooted issues.
- It must be Friday - they are laying people off again
One of the best essayists in the blogosphere today, David St. Lawrence (via Ripples) wonders if the business decision to layoff staff acquired during good times really addresses what ailing the company. Another good discussion of the importance of culture within a business.
Carnival of Debt Reduction
Jeffrey Strain of Personal Financial Advice has put his foot down this week and weeded out all the non-debt reduction related posts that have filled recent editions of the Carnival of Debt Reduction. We here at Political Calculations are eternally thankful, since we pretty much see the same contributions from carnival to carnival in putting this weekly summary together!
- Try Cash Only - or Debit Only
Ane at Money and Investing begins by looking at recent advertising from Citbank and Visa, then deflates the ad campaigns and argues that responsible credit card holders should pursue a different strategy than the one taking center stage in the ads.
- Using 0% Balance Transfers to Pay Off Debt
Each week that we've put this summary of the best posts we find in the various blog carnivals, we just about always find an excellent entry in the personal finance categories from Jim at the Blueprint for Financial Prosperity. This week's thoughtful entry on whether it makes sense to use the balance transfer strategy to pay off debt is no different!
Carnival of Investing
The 14th edition of the Carnival of Investing is hosted by Neo of Neo's Nest Egg.
- Asset Allocation Basics, Part V Index Investing
Not just a good primer on the various major stock index funds, but one that also shows what a large difference there can be when the same stocks are weighted differently within an index fund. A strong contender for, but not quite, the Best Post of the Week, Anywhere(TM)!
- Credit Bureaus Are Selling Your Personal Mortgage Inquiry
David Porter of the Pacesetter Mortgage Blog has discovered that the big credit bureaus are compiling lists of people who have recently applied for a mortgage and are selling the lists they generate to the highest bidder.
Carnival of Personal Finance
This week's carnival is being hosted by JLP at the recently renamed All Things Fiscal.
- Personal Enrichment: Buy Real Estate Now? Wait Til Mortgage Rates Go Higher!
The world champion post for counterintuitivity goes to the Net Worth Blog, whose observations regarding how high mortgage rates should impact an individual's decision of when to buy a house are certainly interesting!
- IRA Contribution Limit Workaround
Five Cent Nickel is another personal finance blogger well worth bookmarking. This week's thoughts on how one might increase their retirement savings beyond the limits presribed by law for IRAs and 401(k) accounts is well worth considering.
Festival of Frugality
This week's Festival of Frugality is being hosted by Free Money Finance.
- What's the Best Way to Budget?
The fine folks at Firevalt find that rather than holding strict limits on the various categories that make up a monthly budget, it may be better to aim at simply being cash flow positive (income - expenses) during the month.
- Tips for Saving on Energy Costs
It wouldn't really be about frugality if there weren't any money saving tips! The best this week comes from Sound Money Tips, who has found that you might be able to score a seriously discounted kit with items that consume less energy from your local utility.
Carnival of Entrepreneurship
The newest of the major money and business-related blog carnivals is hosted this week by Jeff Cornwall of The Entrepreneurial Mind.
- Focus on Your Value to Each Customer
Chris Yeh of Adventures in Capitalism provides one of the best insights that any prospective entrepreneur should take to heart. The Best Post of the Week, Anywhere(TM)!
Did you ever wonder why so many talking heads on television make a point of shooting down poll results related to political questions where the respondents aren't limited to the pool of registered voters?
Well, we didn't either here at Political Calculations, but thanks to research by the U.S. Census (available as a 592KB PDF document), we now know why: over 7 out of 8 registered voters vote (at least in the last big election in 2004)!
That compares to less than 6 out of 10 of the general population of the United States who are the legal voting age of 18 or older, and a bit more than 6 out of 10 who are also U.S. citizens. The following graph from the Census' study illustrates the actual percentages and numbers:
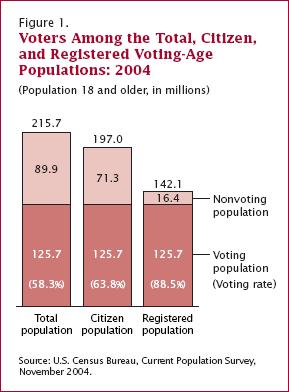
So, the next time you hear about a political poll whose results aren't exclusively collected by surveying the pool of registered voters in the U.S., remember that it probably isn't worth the dollar value of the electrons being transmitted to communicate its results!
This is the latest collection of notes taken from real-live medical charts that have arrived at my e-mail inbox. I don't know what they're feeding the doctors and nurses in the hospital anymore, but my guess is that the ones who wrote these gems could use another cup of coffee....
Patient arrived by avalanche.
This is why attempting to shorten emergency response times by locating the hospital at the foot of Ski Resort Mountain turned out to be a bad idea.
Patient stable all morning, in asystole.
Stable all morning, dead, what's the difference?!
Road Traffic Accident, back seat driver.
Hospitals get more business this way....
The lab test indicated abnormal lover function.
Take two Viagra and call the doctor in the morning.
Exam of genitalia reveals that he is circus sized.
Okay, let's cut that back to one Viagra.
The baby was delivered, the cord clamped and cut, and handed to the pediatrician, who breathed and cried immediately.
Very sensitive, the pediatrician.
The skin was moist and dry.
Don't you just hate combination skin?
Rectal exam revealed a normal size thyroid.
Dr. Rotorooter gets to the bottom of everything.
The patient had waffles for breakfast and anorexia for lunch.
They must have seen the menu for the hospital cafeteria....
Labels: health care, none really
Craig Newmark of Newmark's Door recently pointed to the Labor Research Association's table outlining the overall decline of union membership in the United States since 1948. We here at Political Calculations thought that kind of data would be easier to show off as a chart:
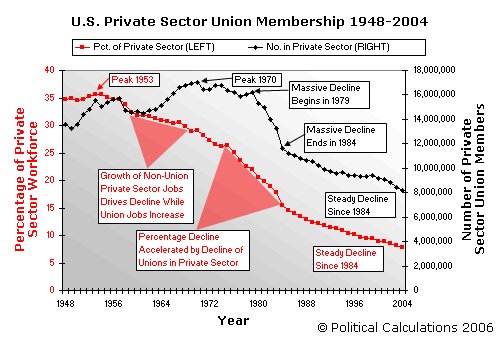
Periods Defining the Decline of Unions in the U.S.
1959-1970: After peaking in 1953, and largely leveling off afterward, union membership as a percentage of the private sector workforce began declining during the period of 1959 through 1970 largely due to the much faster growth of the non-unionized ranks of the private sector. Remarkably, this occurred even as the total number of private sector labor union jobs increased throughout this period. At its peak in 1970, the number of union jobs in the private sector nearly reached 17 million.
1971-1978: The years between 1970 and 1979 mark the beginning of the decline of the total number of labor union member in the U.S. This period saw several major shocks to the U.S. economy - high inflation began taking root, the Arab oil embargo, and increased competition from foreign-based companies that was largely absent in the U.S. following the end of World War II. All of these factors combined in a kind of "perfect-storm" event to negatively impact industries where labor unions were strongly entrenched, most visibly in the U.S. domestic automotive industry.
1979-1984: The greatest period of decline for U.S. union membership occurred between 1979 and 1984, as the combination of high inflation and low economic growth that defined the Carter's administration's economic ineptitude were reversed by the Federal Reserve's tight money policies under Paul Volcker, which had the negative effect of creating a recession that accelerated the loss of union jobs in this period. The large scale losses of private sector union jobs continued until 1984 when, with inflation largely tamed, the Reagan administration's pro-growth economic policies fully took hold.
Since 1984: The overall decline in the number of private sector union members has largely stabilized at a near constant annual rate of decline of 1.7% since 1984, declining steadily from 11.6 million in 1984 to 8.2 million in 2004. The percentage of union members within the private sector has declined from 15.5% of the private sector labor force year in 1984 to just 7.9% in 2004. Here, the combination of faster economic growth of the non-unionized private sector in the U.S. along with the real decline of the unions throughout this period accounts for the ongoing trend toward less unionization in the most productive portion of the U.S. economy.
Lá Fhéile Phádraig Sona Dhaoibh!
Or rather, Happy St. Patrick's Day! (HT: Captain's Quarters.) This week we're celebrating all kinds of green, whether Irish or the ordinary, everyday U.S. currency kind in reviewing this week's money-related blog carnivals, so let's get right to it!
The Carnival of Investing
What better way to kick of this week's review than with the making of the green! This week's investing carnival is hosted by the Investor Geeks.
- An Interesting Chart
We admit we're suckers for a good chart, and a Geek's World starts with one showing the bull and bear markets in the S&P 500 Index from 1962-2005. Add some pretty solid basic investment advice, and you've got a pretty good post. If you're thinking about putting money into an S&P 500 index fund, you might also want to take a look at the historical best and worst case returns for the index.
- Advice: Listen to a Comedian Sometimes
Canadian Financial Stuff brings up a really good question - would you make more money investing in a bank's stock or by putting your money in one?
The Carnival of Debt Reduction
No Credit Needed hosts the twelfth edition of the carnival dedicated to keeping more green (by cutting back on the borrowing of it!)
- Advice on Reducing Your Debt
The MightyBargainHunter highlights the key points on what you should do if you're working to keep your debt under control.
- Debt Control: Am I in Trouble?
The Finandom Blog provides guidance for knowing when you need to say "When" when it comes to debt!
The Carnival of Entrepreneurship
Dane Carlson of the Business Opportunities blog hosts this week's celebration of new green!
- Rearrange Your Way to Success
Do you need a new idea to launch a new business? David Lorenzo of Career Intensity finds that the most successful entrepreneurs are often the ones who take an old idea and put it to work in new ways.
The Carnival of Personal Finance
Jeffrey Strain of the Personal Finance Advice blog hosts this week's edition of the carnival for keeping the green around your life!
- What I'd Waste Money on If I Could
Frank the Financially Savvy Atheist is slobbering over his keyboard. Literally. Good thing he's got good financial discipline....
- Cash Only Experiment (Dead In Water)
Last week, we cited No Credit Needed's experiment on making due only with a fixed amount of cash for the month of March. This week, it all ends badly, but with the promise to start all over again next month....
The Festival of Frugality
The festival of keeping the green by not ever parting with it is hosted by Neo's Nest Egg this week!
- Buying Legos on the Cheap
At a certain point, a parent is going to have to buy a bunch of bricks - raising4boys asks why not do it for much, much less than what you'd have to pay retail?
The Carnival of the Capitalists
The greenest carnival of them all is hosted by Pro Hip Hop this week! This week's top posts include:
- Where Do I Go From Here?
Adrian Savage of The Coyote Within offers the Best Post of the Week, Anywhere(TM) with advice on how to set a course for your career.
- Would You Rather Have Great Marketing and Sales or A Great Product?
JSLogan of the BizInformer asks a very good question - what good is an excellent product if you can't connect it to potential customers?
Update (20 March 2006): Welcome Radio Equalizer fans! For those just tuning in, the post below helped kick off the blogosphere's project to answer the question "Just how many Air America Radio affiliates are there anyway?" For the latest count, be sure to follow Brian Mulroney's developing list!
In our recent look at the Air America Radio (AAR) network's ratings in its top markets, we observed that Wikipedia's list of AAR's local broadcast affiliates left a little something to be desired in up-to-date accuracy (that said, it was a great starting point!) Of the 84 stations listed, here are some of the more interesting ones, which we present here purely for fun:
Stations with No Verifiable AAR Programming
The following stations listed among AAR's affiliates were found to have no identifyable AAR programming content, here listed according to their U.S. radio market ranking:
- (4) KSRO 1350 AM - San Francisco, CA
- (23) WPTT 1360 AM - Pittsburgh, PA
- (136) WTWK 1070 AM - Plattsburgh, NY
- (235) WINI 1420 AM - Carbondale, IL
Listed Affiliates That Have Dropped AAR Programming
(25) WTAM 1100 AM - Cleveland, OH only recently announced that it would discontinue broadcasting Jerry Springer's radio show, which constituted its entire AAR programming content. Other stations that have recently dropped AAR programming (and are not listed in Wikipedia's list) include:
- (15) KXXT 1010 AM - Phoenix, AZ.
- KKNS 105.9 FM - Missoula, MT
Stations with Low AAR Programming Content
For this category, we're only listing stations that carry just a fraction of AAR's primary weekday national programming content. These stations count as true AAR affiliates, but make up the balance of their programming schedule with other nationally syndicated hosts or local programming.
- (36) WHJJ 920 AM - Providence, RI (Randi Rhodes)
- (52) WHLD 1270 AM - Buffalo, NY (Al Franken, Randi Rhodes, Mike Malloy)
- (63) KUMU 1500 AM - Honolulu, HI (Al Franken, Randi Rhodes)
- (73) WARF 1350 AM - Akron, OH (Al Franken, Randi Rhodes)
- (172) KUDO 1080 AM - Anchorage, AK (Al Franken)
- (179) WYOS 1360 AM - Binghampton, NY (Al Franken, Randi Rhodes)
- (192) WWKK 750 AM - Petoskey, MI (Al Franken, Randi Rhodes, Jerry Springer, Majority Report)
- (219) WWWI 1270 AM - Brainerd, ND (Al Franken)
Update (16 March 2006): The Radio Equalizer brings word that KRFT 1190 AM will be adding Al Franken's show to its daily programming.
Stations with No AAR Programming, but Listed as an Affilate Anyway
This is kind of an interesting category that only covers one listed AAR affiliate to our knowledge. The only identifiable AAR host on KRXA 540 AM in Salinas/Santa Cruz, CA was Mike Newcomb, a medical doctor and failed fringe candidate for governor in Arizona, whose affiliation with AAR stems having had broadcasted locally on former AAR Phoenix affiliate KXXT 1010 AM and also on KRXA. Newcomb is no longer broadcasting on either. Not really sure why this station was ever listed as one of AAR's affiliates.
Very Small Stations in Very Small Markets
The following AAR affiliates are either broadcasting in some of the smallest radio markets in the U.S., or simply don't register in whatever larger radio market that might include them.
- KTHH 990 AM - Albany, OR
- KBBR 1340 AM - Coos Bay, OR
- WHMQ 1240 AM - Greenfield, MA
- WELY 1450 AM - Hibbing, MN
- KONG 570 AM - Kauai, HI
- KAOI 1110 AM - Maui, HI
- WEED 1390 AM - Rocky Mount, NC
- KVOT 1340 AM - Taos, NM
How Many Affiliates?
By our count, we believe that AAR only has 78 79 (see March 16 update above) affiliates broadcasting actual AAR produced programming at this time. It will be interesting to see how things unfold should AAR's flagship affiliate WLIB in New York City ceases to be the network's voice in the nation's largest radio market.
Labels: business
Shortly after posting yesterday's analysis of AAR's ratings, I received an e-mail that made a very good point regarding the full magnitude of the impact that Air America Radio (AAR) would face if it loses it's flagship WLIB affiliate in New York City. In short, the station has a powerful enough signal to reach a number of other radio markets in the northeast, which significantly adds to the number of Age 12+ listeners for AAR's programming via WLIB itself.
The following short table shows all the markets for which AAR's broadcasting through its current WLIB affiliate has registered measurable ratings:
| AAR's Ratings for WLIB, SP05-WI06 |
|---|
| Rank | State | City | Age 12+ Population | SP 05 | SU 05 | FA 05 | WI 06 | Average | Estimated Audience |
|---|---|---|---|---|---|---|---|---|---|
| 1 | NY | New York | 15,332,000 | 1.0 | 1.2 | 1.4 | 1.4 | 1.25 | 191,650 |
| 18 | NY | Nassau-Suffolk | 2,393,800 | 1.4 | 0.8 | 0.9 | 0.8 | 0.98 | 23,340 |
| 39 | NJ | Middlesex | 1,383,100 | 0.5 | 0.9 | 0.0 | 0.0 | 0.35 | 4,841 |
| 120 | CT | Bridgeport | 395,600 | 0.7 | N/R | 0.5 | N/R | 0.60 | 2,374 |
| 142 | CT | Stamford | 304,800 | 0.0 | N/R | 1.1 | N/R | 0.55 | 1,676 |
| 196 | CT | Danbury | 188,000 | 0.0 | N/R | 0.4 | N/R | 0.20 | 376 |
Together, the other markets in which AAR's signal is heard represent an additional 32,606 Age 12+ listeners, bringing the estimated total of AAR's audience on WLIB to 224,256. This also brings AAR's estimated total audience in the U.S.' Top 100 Radio Markets to 1,024,914 listeners per average quarter hour.
WLIB's share of Air America Radio's total estimated audience per average quarter hour in the U.S.' Top 100 radio markets is therefore increased to 21.9%. The following chart illustrates WLIB's proportional share of AAR's audience in these regions, along with the next four stations with the biggest audiences for AAR's programming:

The chart above illustrates that WLIB alone represents more than one-fifth of AAR's total audience in the Top 100 radio markets in the U.S. Even more remarkable is that AAR's 5 biggest markets by audience size account for more than half of AAR's audience in the Top 100 radio markets.
We also note that our previous point about the importance of the New York City radio market ot AAR remains valid. Assuming that WLIB generates 22% of AAR's revenue from its operations, the loss of this affiliate without corresponding reductions in the network's cost of operations would significantly increase its financial strain, making it all but certain that significant cost cutting would ensue as the network struggles to survive.
Labels: business
There have been a number of changes in AAR's overall ratings performance as the preliminary figures for the Winter 2006 period recorded below have been finalized. Most notably, AAR's ratings at its flagship station WLIB in New York City dropped 0.8 share per average quarter hour. The four-quarter average rating for AAR in New York City is 1.1. This represents a loss of roughly 23,000 Age 12+ listeners (or 2.2% of AAR's total audience) compared to the figures recorded in the table below!
Rumors have been circulating for a little over a week now regarding whether or not Air America Radio (AAR) will be able to continue broadcasting through their flagship New York City affiliate WLIB. That potential trouble has led us to ask: "How important is being able to broadcast locally in New York City to AAR?"
To get a sense of what the potential impact of losing its voice in New York City might mean, we went mining through the publicly available radio ratings databases maintained by Arbitron and Radio & Records, looking to see how AAR's local affiliates are faring in the Top 100 radio markets in the U.S. Our goal – to get a good approximation of the size of AAR's listening audience in their largest markets.
We started with Wikipedia's list of AAR's local broadcast affiliates (with some adjustments, outlined later in this post), and looked at each affiliate's ratings performance over the four most recent survey periods (the most recent, Winter 2006, is only partially complete at this point), which provide a year's worth of ratings data. We found the average rating for each market over these survey periods, as well as the average rating for rating period for all these markets.
The ratings represent the percentage of each local market's listening population (Age 12+) over an Average Quarter Hour (AQH) time period. To estimate the potential size of AAR's audience in each of its local markets, we took the average rating for each market (treating it as a percentage) and multiplied it by that market's Age 12+ potential listening population.
We've summarized our results in the following dynamic table. You may click any of the column headings to sort the data from low to high or vice versa (by clicking the column heading again).
The ratings for Winter 2006 recorded below are Arbitron's preliminary figures for the period - you can find the final report of the Winter '06 ratings at Radio & Records as they come in!
| AAR's Ratings in the Top 100 Radio Markets, SP05-WI06 |
|---|
| Rank | State | City | Station(s) | Age 12+ Pop. | SP 05 | SU 05 | FA 05 | WI 06 | Avg. | Estimated Audience |
|---|---|---|---|---|---|---|---|---|---|---|
| 1 | NY | New York | WLIB 1190 AM | 15,332,000 | 1.0 | 1.2 | 1.4 | 1.4 | 1.25 | 191,650 |
| 2 | CA | Los Angeles | KTLK 1150 AM | 10,790,100 | 0.8 | 0.9 | 0.7 | 0.8 | 0.80 | 086,321 |
| 3 | IL | Chicago | WCPT 850 AM | 07,698,300 | 0.4 | 0.7 | 0.8 | 0.7 | 0.65 | 050,039 |
| 4 | CA | San Francisco | KQKE 960 AM | 05,829,700 | 1.2 | 1.2 | 1.2 | 1.2 | 1.20 | 069,956 |
| 5 | TX | Dallas-Fort Worth | KXEB 910 AM | 04,730,200 | 0.5 | 0.0 | 0.0 | 0.0 | 0.13 | 005,913 |
| 8 | DC | Washington | WWRC 1260 AM | 04,132,800 | 0.4 | 0.0 | 0.5 | 0.4 | 0.33 | 013,432 |
| 9 | MI | Detroit | WDTW 1310 AM | 03,892,600 | 0.4 | 0.0 | 0.5 | 0.7 | 0.40 | 015,570 |
| 10 | GA | Atlanta | WWAA 1690 AM | 03,860,100 | 0.7 | 0.0 | 0.4 | 0.4 | 0.38 | 014,475 |
| 11 | MA | Boston | WKOX 1200 AM & WXKS 1430 AM | 03,841,100 | 0.6 | 0.7 | 0.7 | 0.8 | 0.70 | 026,888 |
| 12 | FL | Miami | WINZ 940 AM | 03,505,100 | 2.0 | 1.5 | 1.9 | 1.6 | 1.75 | 061,339 |
| 14 | WA | Seattle | KPTK 1090 AM | 03,204,800 | 1.4 | 2.0 | 2.3 | 2.7 | 2.10 | 067,301 |
| 15 | AZ | Phoenix | KXXT 1010 AM | 02,938,500 | 1.1 | 1.5 | 1.2 | 1.1 | 1.23 | 035,997 |
| 16 | MN | St. Louis Park | KTNF 950 AM | 02,632,400 | 1.0 | 1.2 | 1.1 | 1.1 | 1.10 | 028,956 |
| 17 | CA | San Diego | KLSD 1360 AM | 02,484,900 | 1.7 | 1.8 | 3.1 | 2.5 | 2.28 | 056,531 |
| 22 | CO | Denver | KKZN 760 AM | 02,157,700 | 2.0 | 1.9 | 1.8 | 1.4 | 1.78 | 038,299 |
| 24 | OR | Portland | KPOJ 620 AM | 01,963,400 | 4.5 | 4.4 | 4.1 | N/A | 4.33 | 085,081 |
| 27 | CA | Riverside | KCAA 1050 AM | 01,799,900 | 0.0 | 0.0 | 0.0 | 0.0 | 0.00 | 000,000 |
| 28 | OH | Cincinnati | WCKY 1530 AM | 01,705,200 | 0.8 | 1.3 | 1.3 | 0.9 | 1.08 | 018,331 |
| 30 | TX | San Antonio | KTXX 103.1 FM | 01,552,100 | 0.0 | 0.0 | 0.0 | 0.0 | 0.00 | 000,000 |
| 38 | OH | Columbus | WTPG 1230 AM | 01,401,300 | 1.0 | 0.9 | 1.1 | 0.9 | 0.98 | 013,663 |
| 42 | TX | Austin | KOKE 1600 AM | 01,204,800 | 1.1 | 0.7 | 0.8 | 1.2 | 0.95 | 011,446 |
| 43 | NC | Chapel Hill | WCHL 1360 AM | 01,143,700 | 0.0 | 0.0 | 0.9 | 0.6 | 0.38 | 004,289 |
| 47 | LA | New Orleans, Baton Rouge * | WSMB 1350 AM, WYNK 1380 AM | 01,608,400 | 1.0 | 1.2 | 0.0 | 0.0 | 0.54 | 008,645 |
| 49 | TN | Memphis | WWTQ 680 AM | 01,047,900 | 0.8 | 0.5 | 0.5 | 0.5 | 0.58 | 006,025 |
| 52 | NY | Buffalo | WHLD 1270 AM | 00,989,400 | 0.0 | 0.0 | 0.0 | 0.0 | 0.00 | 000,000 |
| 54 | NY | Rochester, NY | WROC 950 AM | 00,941,600 | 0.9 | 1.4 | 0.8 | N/A | 1.03 | 009,730 |
| 63 | HI | Honolulu | KUMU 1500 AM | 00,774,500 | 0.4 | 0.0 | 0.4 | N/A | 0.27 | 002,065 |
| 66 | CA | Fresno | KFPT 790 AM | 00,711,700 | 0.4 | 0.4 | 0.4 | 0.4 | 0.40 | 002,847 |
| 67 | MI | Grand Rapids | WTKG 1230 AM | 00,703,400 | 1.0 | 0.8 | 1.2 | 0.9 | 0.98 | 006,858 |
| 70 | NM | Albuquerque | KABQ 1350 AM | 00,654,200 | 2.4 | 1.6 | 2.2 | N/A | 2.07 | 013,520 |
| 73 | OH | Akron | WARF 1350 AM | 00,597,200 | 0.0 | 0.0 | 0.0 | 0.0 | 0.00 | 000,000 |
| 74 | FL | Bradenton | WSRQ 1450 AM | 00,591,500 | 1.1 | N/R | 1.1 | N/R | 1.10 | 006,507 |
| 76 | TX | El Paso | KHRO 1650 AM | 00,573,600 | 0.9 | 1.0 | 0.6 | 0.6 | 0.78 | 004,445 |
| 79 | CA | Monterey | KOMY 1340 AM | 00,555,100 | 0.4 | 0.0 | 0.4 | 0.6 | 0.35 | 001,943 |
| 82 | MA | Springfield | WHNP 1600 AM & WHMP 1400 AM | 00,533,700 | 1.8 | 2.6 | N/A | N/A | 2.20 | 011,741 |
| 90 | SC | Columbia | WOIC 1230 AM | 00,485,400 | 0.9 | 0.9 | 0.9 | 0.5 | 0.80 | 003,883 |
| 96 | WI | Madison | WXXM 92.1 FM | 00,461,700 | 1.7 | 2.3 | 3.8 | N/A | 2.60 | 012,004 |
| 96 | WA | Spokane | KPTQ 1280 AM | 00,461,700 | 1.3 | 1.0 | 2.0 | N/A | 1.43 | 006,618 |
| AAR's Estimated Average Audience and Ratings in the Top 100 Radio Markets | ||||||
|---|---|---|---|---|---|---|
| Age 12+ Population Sum | SP 05 Average Rating | SU 05 Average Rating | FA 05 Average Rating | WI 06 Average Rating | Overall Average Rating | Estimated Audience |
| 99,491,700 | 1.0 | 1.0 | 1.1 | 0.8 | 0.96 | 992,308 |
- N/A = Ratings Not Available at Time of Posting
- N/R = Ratings Not Collected for Indicated Period
- Average Ratings for each market determined by taking the average of available ratings beginning with the Spring 2005 period (SP 05) and ending with the Winter 2006 (WI 06) partial rating period as of March 10, 2006.
- Age 12+ Listeners per Average Quarter Hour determined by converting Average Ratings for each market into a percentage and multiplying by total population of Age 12+ listeners in radio market as documented by Radio & Records.
- Average Ratings for each reporting period were determined by finding the average of all measured ratings in that reporting period.
Crunching Numbers
Wikipedia's list of AAR's local affiliates includes 84 radio stations, of which 47 are in the top 100 U.S. radio markets. After adjusting the list of affiliates (see below), we looked at the ratings data for some 40 stations in 38 radio markets. In these markets, the total Age 12+ potential listening population is 99,491,700. AAR's average rating share of this potential audience is just under 1.0 (at 0.96) which, if taken as a percentage of the total Age 12+ population, would represent an audience of 992,308 people for an Average Quarter Hour (AQH).
AAR's New York City affiliate WLIB accounts for nearly one-fifth (19.3%) of its estimated audience in the Top 100 U.S. radio markets. AAR's next two largest audiences may be found in Los Angeles (8.7%) and Portland, OR (8.6%). Rounding out AAR's top 5 markets are San Francisco (7.0%) and Seattle (6.8%).
Interesting tidbit: If we applied a 1.0 rating share to AAR's remaining markets, we would only add somewhere between 60-70,000 more listeners to the total above!
What Losing NYC Would Mean to AAR
Money is largely made in the radio broadcast business through advertising, and advertising dollars are divvied out according to not just the size of a radio station's audience, but the demographics of who is actually tuning in. We can assume that AAR's core listening audience reflects pretty much the same demographic grouping from market to market, so the financial impact of losing a broadcast affiliate will therefore be directly proportionate to the relative size of its audience.
We therefore estimate that the reduction of AAR's total advertising revenue arising from no longer being able to broadcast on its current affiliate in New York City will be on the order of 18 to 22%. The reduction in total operating revenue may be mitigated by switching to another radio station in the New York City radio market, but the degree to which AAR may be successful in obtaining an equivalent broadcast outlet remains uncertain.
Update (14 March 2006): In the analysis above, we only looked at the primary markets for WLIB - we have additional analysis that takes a closer look at WLIB's bigger footprint.
What AAR's Management Should Do
If AAR is in the broadcast business for the purpose of making money in the broadcast business, AAR's senior leadership should focus first upon obtaining a broadcast outlet in the New York City market. Even if the only available options for broadcasting are stations that lack equivalent signal strength to reach throughout the region compared to AAR's current affiliate WLIB, the size of the NYC market and the potential advertising revenue it represents is simply too large to write off. Ratings 50% lower than what AAR produces in NYC today would still represent an audience greater in size than its next two largest markets.
Update (17 March 2006): The Radio Equalizer reports that a short-term deal has been struck that will allow AAR to remain at WLIB for "several months."
The rest of the strategy AAR must follow would be dictated by its overall business health. If AAR were generating enough revenue from its operations to overcome the network's operating expenses, AAR could easily weather the loss of its NYC affiliate (this does not appear to be the case.) Instead, AAR's operating costs appear to outweigh its operating revenue (even before the loss of its current NYC affiliate), which means that AAR's management needs to take immediate steps to bring those costs down substantially to be in line with its looming reduced level of revenue.
AAR needs to focus upon getting the biggest return in revenue for each dollar it spends to stay in business. For example, programming whose cost to produce significantly outweighs the relative amount of revenue it brings in to the network will need to be eliminated or substantially revamped.
AAR could, in the interim, continue operating as it does today, but the impact would be to significantly increase its effective cash burn rate, setting it upon a course toward bankruptcy, sooner. Even with additional cash infusions from "white knight" investors, there's little business sense it keeping a business afloat if it isn't at least operationally profitable, and it makes even less sense if its management takes no steps to make it so.
Unless, of course, AAR is continuing in the broadcast business for some purpose other than that of making money in the broadcast business. If that's the case, their troubles may only be beginning.
Previously on Political Calculations
- The Future of Air America
We kicked off our series of posts analyzing Air America Radio viability as a business with this post. We really didn't think it would go much further than this!
- Air America, Again
We found that AAR doesn't just have competition from the right - it has it on the left as well....
- The Financing of Air America Radio
A throw-away post that let us fill space with some information on where AAR got its financing that we had come across in our previous analysis.
- Time to Harvest or Divest
As AAR appeared to be running into significant turbulence, we updated our original strategic business analysis, finding that what AAR's management needed to do was to find "white knight" financing or to start making moves to significantly cut its costs.
- A Top Ten Countdown
We couldn't resist applying a list a bankruptcy lawyer came up with for a failing company to AAR's known problems - lucky thing AAR has benefitted from the generosity of multi-millionaires with deep pockets.
- Profiles in Semi-Obscurity
Another space-filler post where we just unloaded background information about various members of AAR's Board of Directors that we had come across in previous analysis.
And Since This Post....
- A Bigger Footprint
An intrepid e-mailer let us know that AAR's flagship affiliate WLIB had a bigger footprint than just the New York City market - plus, we find that roughly half of AAR's audience is in just five cities.
- Profiling a Handful of AAR's Local Affiliates
Once again, we unload information we collected in other analysis. This time, we estimate just how many local AAR affiliates there are by determining where they're not.
Adjustments Made to List of Affiliates
Wikipedia's list of 84 AAR affiliates (accessed on March 10, 2006) was not as up to date or as accurate as we might have hoped. The following adjustments were made for this analysis:
Listed Affiliates Not Carrying Sufficient (or Any) AAR Programming
We omitted any listed AAR affiliate from this analysis that carried fewer than five hours of AAR programming on weekdays (not including rebroadcasts). We did so since the ratings for these stations would most likely be the result of the station's other programming. This excludes the following stations:
- KSRO 1350 AM – San Francisco, CA (4).
- WPTT 1360 AM - Pittsburgh, PA (23).
- WTAM 1100 AM - Cleveland, OH (25).
- WHJJ 920 AM - Providence, RI (36).
- WJNO 1290 AM - West Palm Beach, FL (46).
- KRXA 540 AM - Salinas/Santa Cruz, CA (79).
- WMAS 1450 AM - Springfield, MA (82).
We did include affiliates that broadcast just five hours of AAR programming per weekday. In the top 100 radio markets, these stations include:
- KUMU 1500 AM – Honolulu, HI (63).
- WARF 1350 AM – Akron, OH (73).
Adding Affiliates Not Listed
We added former Phoenix affiliate KXXT 1010 AM (15) since it only recently stopped broadcasting AAR programming.
Affiliates Not Broadcasting AAR Programming Long Enough
We removed Sacramento affiliate KCTC 1320 AM (26) since it did not broadcast AAR programming during the Spring, Summer and Fall 2005 rating periods.
Combining Ratings for Affiliates
We combined the ratings for AAR's two affiliates in Boston (11). We also combined AAR's two affiliates that are in close proximity to each other in the Springfield, MA (82) radio market.
We've also combined the ratings for New Orleans (47) and Baton Rouge (83), this time by averaging the ratings of both cities together, while only adding the population figures. This is a special case, which we justify doing given the mass relocation of people from New Orleans to Baton Rouge following September 2005's Hurricane Katrina.
Other Notes
Ratings of Zero
Now, about those stations that have ratings equal to zero. The obvious question that might be asked about these stations is "If the ratings are zero, does that mean that nobody is listening?" The answer is that might indeed be the case, but it would be highly unlikely! Given how the ratings are measured, it's much more likely that the survey simply missed capturing an adequate number of members of the station's audience to be recorded. It's mainly an indication that substantially fewer people are tuning in compared to other stations with measurable ratings in the same survey.
It's also very likely that across the spectrum of AAR's broadcast affiliates, some affiliates are "over-represented" much as these stations are "under-represented." Both these effects should cancel each other out in the big picture, leaving a relatively small error in the size of AAR's total listening population.
Age 12+ Population
We used the Age 12+ Population since it's readily available in the publicly available databases of radio ratings. We justify using this data (as opposed to specific demographic data that measures the real audience for a radio station) since we're trying to gauge the size of a potential listening audience – as opposed to allocating advertising dollars according to who's actually listening (which is why the more detailed data is collected!)
Stations with Less than 100% AAR Programming
Using the publicly available radio databases, we can't drill down into the data enough to see how many listeners for a given station are listening to their AAR programming content. We therefore assumed that the station's overall ratings are shared by their AAR content.
Labels: business
Okay, we're turning last week's post title for summarizing and linking to the best contributions from money-related blog carnivals into a regular feature! Once again, we've sorted through a couple hundred contributions to all the carnivals named below, and have extracted the top posts, the sharpest analysis and anything we thought was truly cool, including the Best Post of the Week, Anywhere! Keep reading to find out who took the top honor this week!
Carnival of the Capitalists
This week's CotC is hosted by FMF of Free Money Finance.
- Some Assembly Required
BPG of BigPictureSmallOffice.com's post on the art of negotiation nearly took the Best Post of the Week, Anywhere(TM) award this week for good reason. Read and see why.
- What's Your Motivation Threshold?
Steve Pavlina has a very interesting take on the role that motivation plays in determining success or failure in achieving a goal. Plus, he provides a mental picture of Socrates dunking a young man's head in the water and nearly drowning him after the young man asked him how to acquire wisdom.
Carnival of Entrepreneurship
The carnival for entrepreneurs is being hosted by David Daniels at Global Market Development this week.
- Why Most Businesses Fail (a Theoretical Model)
The best post of the week, anywhere, is MarkTAW.com's post on the topic of what it takes to make a new business successful. It's a long post, but well worth reading (at least twice!) if you're even thinking about starting up your own enterprise.
Carnival of Investing
This week's Carnival of Investing is being hosted by Jeffrey Strain of Personal Finance Advice.
- How Do You Think About Money?
Dan Melson of Searchlight Crusade makes some really good points about money - it really is all about what it can do!
- Currency Devaluation Watch: Zinc and Pennies
Daily Dose of Optimism is watching the commodity prices for zinc and has pinpointed the price at which they'll go through all their pennies (minted since 1982) for the sake of melting them down! Of course, pennies minted before 1982 (made from copper) are already at that point!
Carnival of Personal Finance
The 38th edition of the personal finance carnival is hosted this week at the Canadian Capitalist. Is that an oxymoron?
- RRSP or Mortgage Then
Keeping with the Great White North theme, the Big Cajun Man of Canadian Financial Stuff reviews a series of posts by asking (and answering) a good question for anywhere - which is better: paying off debt or saving and investing for retirement?
- Tax, Inflation and Stock Market Returns
The Real Returns shows how taxes and inflation eat away at the returns earned in stock market investments.
- Cash Only Experiment
No Credit Needed is putting their money where their mouth is - they're only spending a pre-determined amount of cash this month and they're tracking their progress in this post. The photo showing exactly what bills they've used is priceless!
Festival of Frugality
This week, the Festival of Frugality is Simply Thrifty!
- Amazon Money Flood
Did you ever wonder what to do with all those books and other stuff that you've bought over the years that you'll never read or use again? Fearless Money shows off his strategy for using Amazon.com's marketplace to make money from items cluttering up his home.
- Amazon Price Watch Tool
Not straying far from the Amazon empire, Jeffrey of Personal Finance (not to be confused with Jeffrey Strain of Personal Finance Advice) is taking advantage of Amazon's Price Watch tool, which gives its users the opportunity to be sure that they receive the lowest price on items they purchase (within a 30 day window.)
Carnival of Debt Reduction
The blog carnival dedicated to reducing individual debt burdens (now in its 25th edition) is being hosted this week by Jim at the Blueprint for Financial Prosperity.
- Debt Control - Top Ten Causes of Debt from Bankrate.com
Harrison Loke of the Finandom Blog, aka "The Journey to Financial Freedom", provides a listing of the Top 10 reasons people wind up in debt.
I'm taking the liberty of reproducing the following lesson in Bona Fide German Words here, just because the lesson is too funny not to! (HT: Marginal Revolution.)
The words you see below are genuine words. True, they are not words you would find in every-day German, but they are lexically and syntactically legitimate. Theoretically, there is no limit to the compounding of nouns in German. There is a practical limit though -- you run out of breath and you lose sight of the beginning before you reach the end.1) Donaydampfshiffahrtsgesellschafts- kapitaenskajuetenschluesseloch
[The keyhole of the door of the cabin of the captain of a steamship company operating on the Danube]
2) Gesundheitswiederherstellungszusammen- mischungsverhaeltniskundiger
[One who knows the mixture ratio of a concoction that is sure torestore health]
3) Ueberseedeutschlehrerinternetmailing- listenfragenstellundantwortkundigen
[People well versed in asking questions and supplying answers on the Internet Mailing List of German teachers abroad]
But that's not all the fun! The author goes on to create some more:
There follows a small collection of pseudo-compound nouns together with their English equivalents, which illustrate the process of compounding as it occurs naturally in the German language.
German Lesson #7
Dog:                    Barkenpantensniffer
Dog Catcher:            Barkenpantensniffersnatcher
Dog Catcher's Truck:    Barkenpantensniffersnatcherwagen
Garage for Truck:       Barkenpantensniffensnatcherwagenhaus
Truck Repairman:        Barkenpantensniffensnatcherwagen-
                        mechanikerwerker
Mechanic's Union:       Barkenpantensniffensnatcherwagen-
                        mechanikerwerkerfeatherbedden-
                        gefixengruppe

Doctor:                 Chestergethumpenpulsentooker
Nurse:                  Chestergethumpenpulsentookerhelper
Hypodermic Needle:      Chestergethumpenpulsentooker-
                        helperhurtensticker
Backside:               Chestergethumpenpulsentooker-
                        helperhurtenstickerstabbenplatz

Piano:                  Plinkenplankenplunkenbox
Pianist:                Plinkenplankenplunkenboxgepounder
Piano Stool:            Plinkenplankenplunkenboxgepounder-
                        spinnenseat
Piano Recital:          Plinkenplankenplunkenboxgepounder-
                        offengeshowenspelle
Fathers at the Recital: Plinkenplankenplunkenboxgepounder-
                        offengeshowenspellensnoozengruppe
Mothers at the Recital: Plinkenplankenplunkenboxgepounder-
                        offengeshowenspellensnoozen-
                        gruppenuppenwakers

Automobile:             Honkenbrakenscreecher
Gasoline:               Honkenbrakenscreecherzoomerjuicen
Driver:                 Honkenbrakenscreecherguidenschtunker
Auto Mechanic:          Honkenbrakenscreecherknockengepinger-
                        sputtergefixer
Repair Bill:            Bankenrollergebustenuptottenliste
No wonder the Germans are such a fun-loving people!
Labels: none really

What does it say about the modern American culture when the Adam Sandler movie Billy Madison is cited by a judge in denying a legal motion, and it’s appropriate?
How bad are things at Air America Radio? Consider this editorial comment from Phoenix, which just saw AAR’s local affiliate drop the troubled network's programming following a change in the station's ownership. One local AAR fan wonders if there's an evil Christian conspiracy afoot in the Valley of the Sun.
 Without a doubt, this is the coolest story of the week (HT: In From the Cold). What's even cooler? A similar, independently-developed civilian prototype that's already flown with an eye to commercial development, coming soon to a brand new spaceport in New Mexico. Even more cool than that? The future competition may be an elevator!
Welcome to the blogosphere's toolchest! Here, unlike other blogs dedicated to analyzing current events, we create easy-to-use, simple tools to do the math related to them so you can get in on the action too! If you would like to learn more about these tools, or if you would like to contribute ideas to develop for this blog, please e-mail us at:
ironman at politicalcalculations
Thanks in advance!
Closing values for previous trading day.
This site is primarily powered by:
CSS Validation

RSS Site Feed
JavaScript
The tools on this site are built using JavaScript. If you would like to learn more, one of the best free resources on the web is available at W3Schools.com.
Other Cool Resources
Blog Roll


