 According to the IRS, in 2005, some 134,372,678 households in the United States filed personal income tax returns. On these tax returns, some 269,043,070 exemptions were claimed. Each one of these exemptions effectively represents one person.
According to the U.S. Census, in 2005, the population of the United States was 295,895,897. So, just doing the quick math, we see that U.S. personal income taxes affect, or are affected by, 90.9% of the U.S. population.
That's a heck of a reach when you think about it! And because the number of people represented by each household has a significant impact upon how much those households pay in personal income taxes, our do-it-yourself income tax code tool will use this data to determine how much the federal government might collect from households at all income levels.
As it happens, this is the third of the three parts we need to reconstruct our lost tool. This data is important in that we'll be using it to directly account for personal income tax credits, which we find to be much more transparent than providing tax deductions that exempt income from taxation.
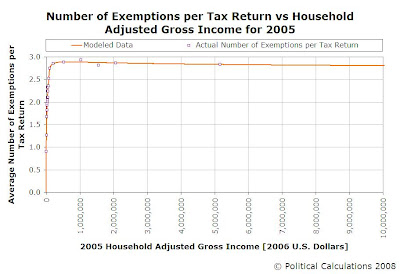
To that end, we've constructed a model of how these exemptions are distributed by household income level. The following chart gives the average number of exemptions per tax return against household adjusted gross income:

One of the more fascinating things we see in how these exemptions are distributed is that those at the lowest end of the income spectrum are by far the most likely to turn up as dependents on other people's tax returns! With federal income tax rules requiring those who can be claimed as dependents on other tax returns to enter zero for the number of exemptions they can claim, we see that the average exemptions claimed below $6000 (in constant 2006 USD) is less than one!
Meanwhile, we find that those making more than $35,000 average at least two exemptions per tax return, and for those households with adjusted gross incomes above $100,000, there are more than 2.75 exemptions per tax return!
The Tool
Update: 29 May 2008: Want to be able to extract the value that goes with a given household adjusted gross income level in that chart above? Here's the tool that goes with the chart!
Labels: taxes
Welcome to the blogosphere's toolchest! Here, unlike other blogs dedicated to analyzing current events, we create easy-to-use, simple tools to do the math related to them so you can get in on the action too! If you would like to learn more about these tools, or if you would like to contribute ideas to develop for this blog, please e-mail us at:
ironman at politicalcalculations
Thanks in advance!
Closing values for previous trading day.
This site is primarily powered by:
CSS Validation
RSS Site Feed
JavaScript
The tools on this site are built using JavaScript. If you would like to learn more, one of the best free resources on the web is available at W3Schools.com.