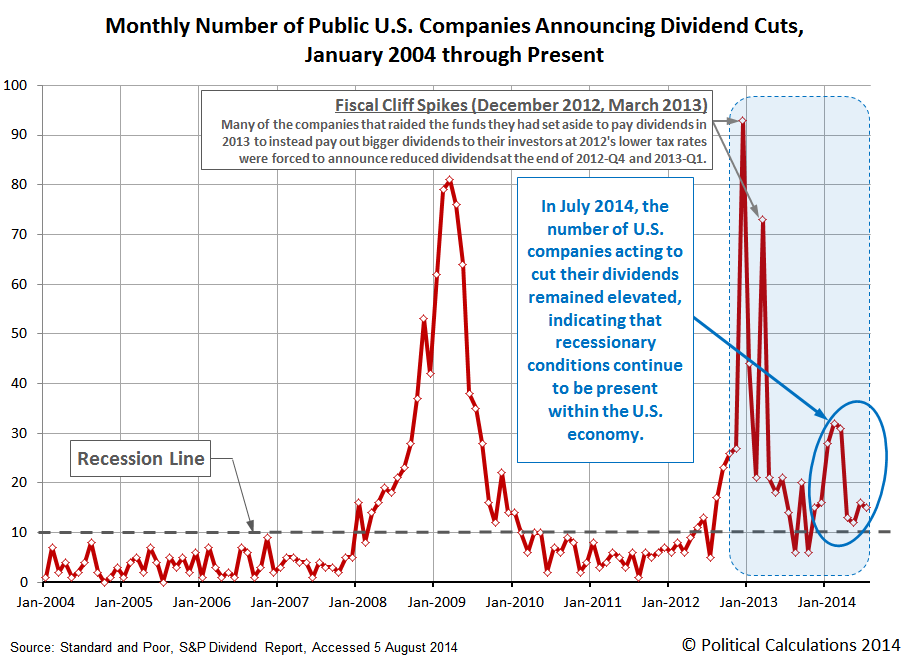
The number of U.S. companies acting to cut their dividends during July 2014 remained elevated at 15, down slightly from the 16 U.S. companies that took similar actions in June 2014, as recessionary conditions continue to be present in the U.S. economy.
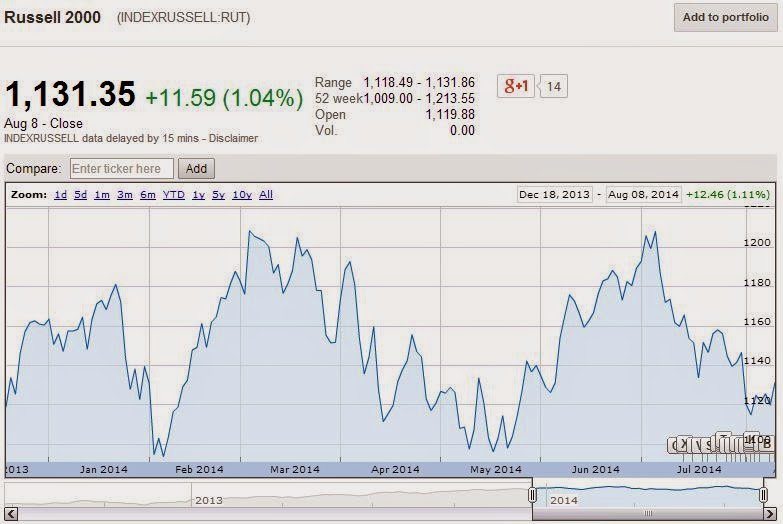
We should note that most of the dividend cutting activity that we've been observing since last year has occurred at companies with comparatively small market capitalizations, such as the companies that make up the Russell 2000 stock market index. Financial Services represents the largest single industrial sector within the Russell 2000, accounting for 24.1% of the index' market capitalization.
Approximately one-third of that weighting is represented by Real Estate Investment Trusts, which we've previously recognized as being especially sensitive to the interest rate hikes that came in anticipation of the Federal Reserve's statement that it would progressively scale back its purchases of U.S. Treasuries and Mortgage-Backed Securities in 2014.
As you can imagine, with such a large portion of the Russell 2000 stock market index being negatively impacted by the increase in interest rates that accompanied the anticipation and realization of the Fed's tapering of its quantitative easing programs, the index has performed poorly in the months since:
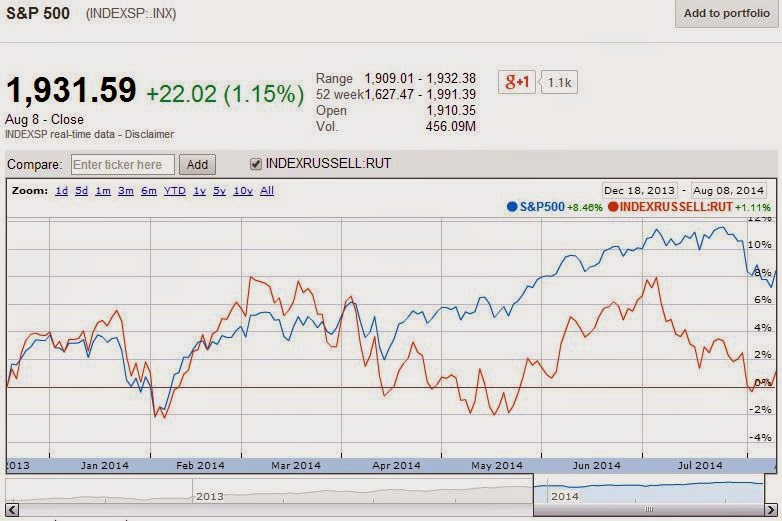
That sensitivity, in turn, accounts for much of the difference in the relative performance of large and small cap companies since the Fed's official statement. Large cap companies, like those of the S&P 500, have performed considerably better since they're less sensitive to the increased costs of doing business associated with higher interest rates.

Since 18 December 2013, the S&P 500 has risen by roughly 8% in value while the change in value of the Russell 2000 has essentially been flat, with a remarkable divergence opening up between the two stock market indices through the year to date. The difference is attributable to the need of a portion of the companies in the Russell to cut their dividends, while those in the S&P 500 have avoided that fate.
Do you suppose the companies that make up the Russell 2000 are the equivalent of canaries in a coal mine? Or are they just telling us the current state of the U.S. economy?
Data Source
Standard & Poor. Monthly Dividend Action Report. [Excel Spreadsheet]. Accessed 4 August 2014.
Labels: dividends, stock market
Welcome to the blogosphere's toolchest! Here, unlike other blogs dedicated to analyzing current events, we create easy-to-use, simple tools to do the math related to them so you can get in on the action too! If you would like to learn more about these tools, or if you would like to contribute ideas to develop for this blog, please e-mail us at:
ironman at politicalcalculations
Thanks in advance!
Closing values for previous trading day.
This site is primarily powered by:
CSS Validation

RSS Site Feed
JavaScript
The tools on this site are built using JavaScript. If you would like to learn more, one of the best free resources on the web is available at W3Schools.com.
Other Cool Resources
Blog Roll


