Once again, the change in the growth rate of stock prices has re-converged with the change in the growth rate of dividends expected in 2015-Q2 in our standard baseline model of how stock prices work. Mind the notes in the margin in the latest update of our favorite chart below.
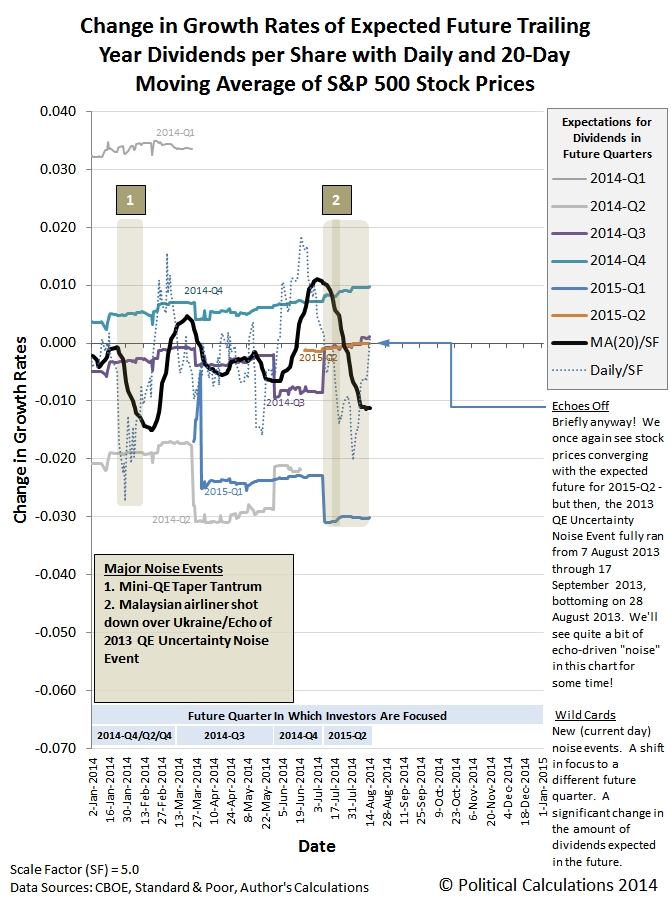
What that means, of course, is that if one recognizes that investors are focused on the future quarter of 2015-Q2 in setting today's stock prices, stock prices are currently just about exactly where they might be expected to be!
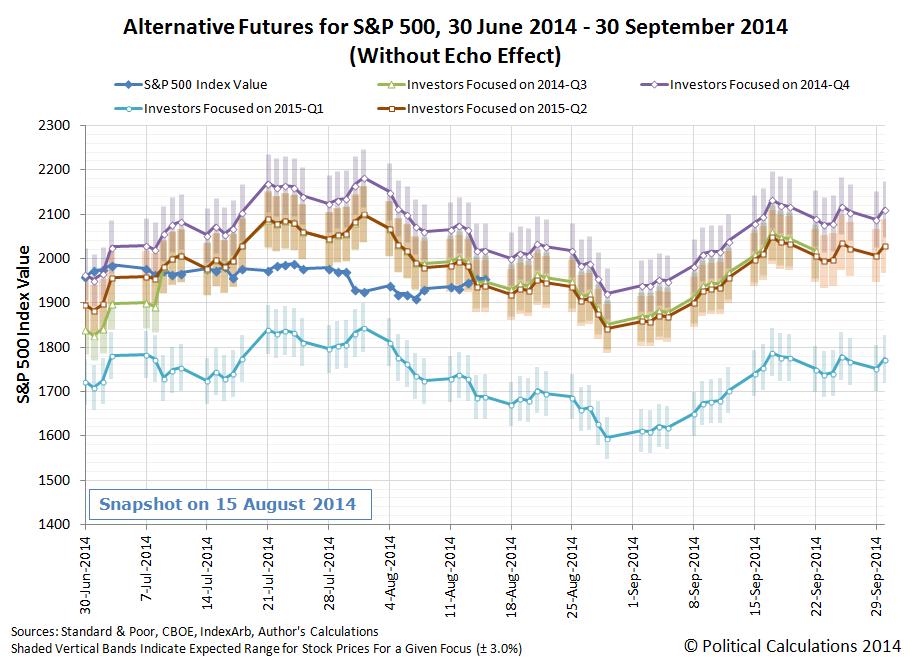
Since this is a new description for us, "standard baseline model" refers to our original model, where we've incorporated historic price and dividend data from one year ago as the baseline from which we project each of the alternative trajectories that stock prices today might follow. Those trajectories are then distinguished by the expectations of the changes in the growth rate of dividends that are expected at different points of time in the future. As we've long observed, stock prices will tend to converge with the trajectory that coincides with the expectations associated with the specific point of time in the future to which investors have focused their forward-looking attention as they make investment decisions today.
The data suggests that investors have been and are currently focused upon 2015-Q2 in setting today's stock prices, since this quarter marks the period of time at which the Federal Reserve is most likely to act to increase short term interest rates in the U.S. for the first time in several years.
Since our stock price forecasting method incorporates historic stock price data, its projections of stock prices are subject to the volatility associated with what we describe as past noise events, which we describe as echoes. Noise events are the relatively short duration periods of time during which stock prices can deviate considerable from their forecast trajectory, which often coincide with major events in the news, which we've also observed would also appear to coincide with investors suddenly shifting their forward-looking attention to a different point of time in the future. Those sudden shifts in focus produce volatility in the level of stock prices.
Where our forecasting methods are concerned, the echoes of these past noise events can create apparent deviations between what our model would appear to project for the trajectory of stock prices, which are really just artifacts of our using historic stock price data that include these periods of volatility. They look like new noise events, but they aren't. They're the echoes of past noise events.
To get around that limitation, we recently adopted the practice of resetting the historic baseline reference points we use for making our future projections to a different point of time in the past. The chart below shows how our model has performed during the current quarter to date after we incorporated the historic stock price and dividend data from two years ago rather than from one year ago as we do in our standard model.
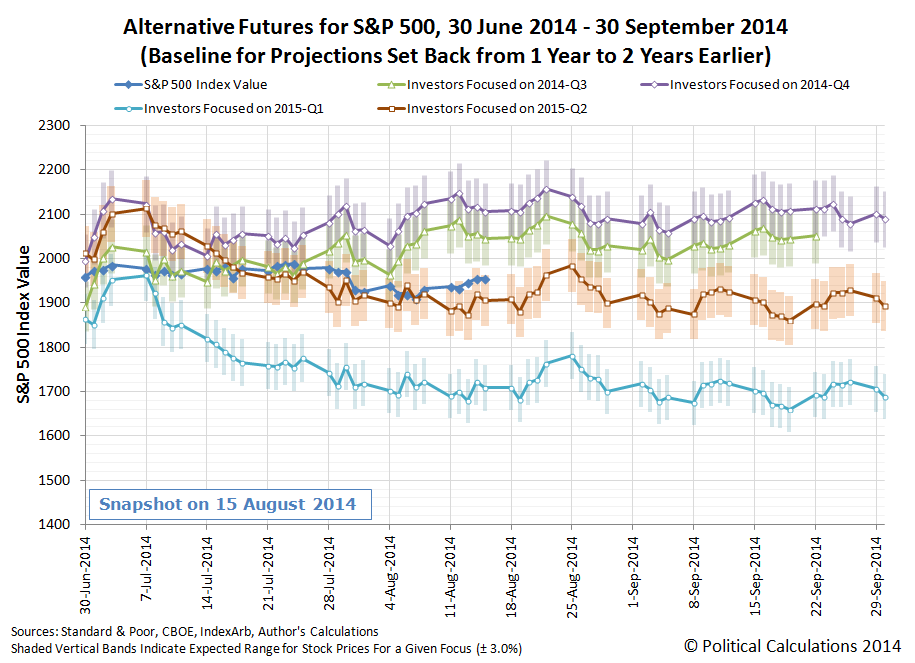
With this baseline reference, which is absent of the effects of the series of echoes that defined the volatility in the period from mid-June through mid-October 2013, we find that stock prices are tracking along with the future trajectory associated with the expectations consistent with 2015-Q2.
It's kind of a curious thing, but we're now in a period where the two projections for 2015-Q2 will track somewhat closely with one another - at least until 12 September 2014. Until then, it would seem that the echoes are off!
Welcome to the blogosphere's toolchest! Here, unlike other blogs dedicated to analyzing current events, we create easy-to-use, simple tools to do the math related to them so you can get in on the action too! If you would like to learn more about these tools, or if you would like to contribute ideas to develop for this blog, please e-mail us at:
ironman at politicalcalculations
Thanks in advance!
Closing values for previous trading day.
This site is primarily powered by:
CSS Validation

RSS Site Feed
JavaScript
The tools on this site are built using JavaScript. If you would like to learn more, one of the best free resources on the web is available at W3Schools.com.
Other Cool Resources
Blog Roll


