A little over a week ago, the Wall Street Journal suggested that the U.S. stock market was especially quiet, which is to say that U.S. stock prices aren't very volatile lately.
Another way to describe that situation is that order in stock prices may finally have returned after having last broken down on 20 August 2015.
So we put that proposition to the test, with the results visually presented below. As best as we can tell, some degree of order returned to the S&P 500 sometime in late March 2016, where we're starting the clock for a new period of order as of the last day of the first quarter of 2016, 31 March 2016.

Since then, we've seen one outlier affecting the overall trend, which corresponds to the reaction of global stock markets to the outcome of the Brexit referendum, in which voters in the United Kingdom directed that nation's politicians to begin exiting from the European Union.
Other than that outlier, which the U.S. stock prices recovered from quickly, we can confirm that there has indeed been very little in the way of volatility in the U.S. stock market. Additional credit may also be given to the rise of oil prices since mid-February 2016, which has boosted the business prospects of the U.S. oil industry, and also the apparent stabilization of China's economy, which both had been major contributors to chaos in the U.S. stock market during much of the latter portion of 2015 and early 2016.
Labels: data visualization, SP 500
Four years ago, in July 2012, an influx of investors in the U.S. real estate market began buying up homes at an accelerated rate, which prompted a sharp rise in median new home sale prices, which lasted for a year.
During that time, the trailing twelve month average of median new home sale prices rose at a rate of $2,476 per month. After July 2013 however that phase of rapid inflation in median new home sale prices came to an end and the trailing year average of median new home sale prices then began escalating at the slower rate of $1,511 per month as the investor activity that had fueled the previous escalation in prices began to abate. That amount is about 39% slower than what was recorded in the year from July 2012 through July 2013.
Going by data that has been revised over the past nine months, that appears to have generally continued through September 2015. Since then, it now appears the the pace of escalation of the trailing twelve month average of median new home sale prices has slowed again, this time to about $934 per month. Coincidentally, that figure is about 38% slower than the typical pace that was seen between July 2013 and September 2015.
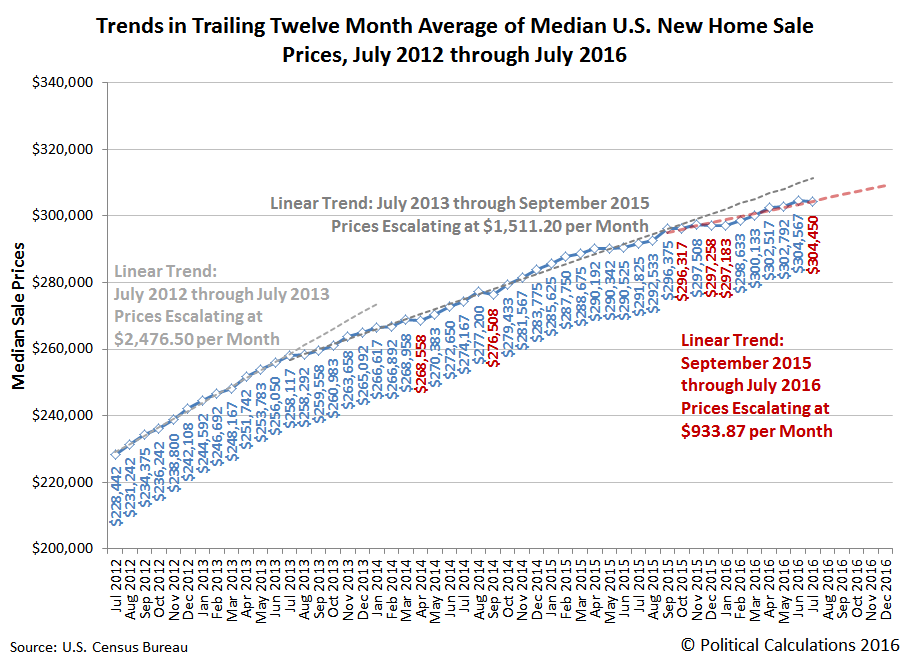
If you look closely at the trailing year average for median new home sale prices, you'll see that the transition to the more recent deceleration isn't as cleanly defined as the prior one. We can make an argument that the newest trend may have started to take hold back in April 2015, where a significant step upward in September 2015's sale prices might well represent the dying gasp of the previous trend as the newer trend became dominant.
Since the most recent four months of data is still subject to revision, it's too early to tell if that similarity in the rate at which the median new home sale prices stepped down from faster growth to slower growth will be sustained, but it certainly is interesting to catch it in this snapshot in time!
Labels: real estate
For a market that hasn't experienced much in the way of volatility lately, Friday, 26 August 2016 was a welcome departure for observers. Unfortunately, if you only tracked the closing price of the S&P 500 from day to day, you wouldn't have noticed!
To see what we mean, let's flip our usual presentation of charts around and show what our modified model of the alternative future for S&P 500 stock prices projected through Week 4 of August 2016:

From the beginning of the week to the end of the week, it would appear that investors kept their forward-looking focus on 2017-Q2 in setting the level of the S&P 500 throughout the week, well within the typical range of volatility we would expect. More to the point however, there was very little movement in the level of the S&P 500 from one day's closing value to the next all throughout the week.
So far, our modified model for projecting future stock prices is providing a more accurate forecast than our standard model, whose projections have been skewed by the echoes of past volatility from last year's market reaction to the meltdown of China's stock markets.

All that said, let's focus on the headlines that influenced the week's market action.
- Monday, 22 August 2016
- Tuesday, 23 August 2016
- Wednesday, 24 August 2016
- Thursday, 25 August 2016
- Friday, 26 August 2016
- Futures flat as investors count down to Yellen speech - this is Reuters' headline before the market opened, before Fed Chief Yellen spoke at Jackson Hole. The S&P 500 would go on to open at 2,175.10, some 2.63 points higher than it closed the day before.
- Bullard agnostic on timing of Fed hike; cites tech stocks - note the overall neutral tone, although St. Louis Fed president Bullard is concerned that stock prices are valued too high. This is how a Fed official can say something without necessarily affecting the market.
- Fed's Yellen says case for interest rate hike has strengthened - and yet, stock prices responded as if investors were reassured that any such action would not take place at any time before 2017, which prompted stock prices to rise. This reaction helps illustrates why we place such emphasis on things said by Fed officials - they have the ability to affect stock prices by shifting the forward-looking focus of investors, either forwards or backwards. In this case, Yellen's comments refocused them toward a more distant future. The S&P 500 would peak at a high of 2,187.94 for the day.
- Wall Street declines after Fischer's hawkish stance on rates - And then the Fed's #2 weighed in, reeling the forward-looking focus of investors back toward the nearer term future. Along the way, stock prices got whipsawed from positive to negative territory, just as we should expect would happen! The S&P 500 dipped to a low of 2,160.39.
- Wall Street slips in wake of comments by top Fed officials - and yet, by the end of the day, the market closed just slightly below where it opened, with the S&P 500 down 3.43 points to finish at 2,169.04.
Here's a screenshot of Friday's Fed official-inspired volatility for the S&P 500:

You can see the market's reaction to Janet Yellen's comments from Jackson Hole, Wyoming at and after 10:00 AM, while the reaction to Stanley Fischer's comments came as he spoke later that morning, at and after 11:30 AM. As a general rule of thumb, it typically takes some 2-4 minutes for the market's reaction to news it wasn't expecting to become noticeable as a change in trajectory for stock prices. For further reading, ZeroHedge has an interesting take on the markets' real time reactions to the major Fed officials' Jackson Hole speeches, which touches on why they responded bullishly to Yellen's seemingly otherwise mildly hawkish comments (a hint of more quantitative easing monetary policy!), as well as an overall post-mortem.
Meanwhile, Barry Ritholtz has succinctly summarized the positives and negatives for the week's market and economic news, which we recommend surveying to get a broader sense of the general investing climate that existed during the week.
Several weeks ago, Political Calculations launched a new series, "Examples of Junk Science", where we are specifically focusing on where flawed analysis and the misuse of data leads to the spread of false or misleading information in the fields of investing, finance and economics.
More than that, we're also seeking to present explanations for why the examples of flawed analysis and misuse of data that we present lead to results that are not valid, which we hope will be beneficial for analysts who seek to make positive contributions in these fields, where the ultimate goal is be to improve the general quality of analysis that is produced altogether. We hope to do that in part by highlighting real examples so you can more quickly recognize them as the pseudoscientific junk they are so you can directly challenge the people who propagate them.
Today's example of junk science is representative of what may quite possibly be the most common way that analysis is twisted to present a misleading picture of the economy. Coincidentally, it is also perhaps the simplest: stating changes in values as a percentage of a percentage.
This is a technique that can greatly exaggerate the significance of a claim, which often will fall apart when put into a more appropriate and relevant context. As such, this kind of data mishandling falls under the precision category of the checklist for how to detect junk science.
| How to Distinguish "Good" Science from "Junk" or "Pseudo" Science | |||
|---|---|---|---|
| Aspect | Science | Pseudoscience | Comments |
| Precision | If numbers are presented in support of a scientific explanation, they must be stated with the precision and accuracy required by their level of significance as determined by known measurement error in the data from which are derived, neither more nor less. | Pseudoscience practitioners will often present numbers with a level of precision and accuracy that exceeds that supported by the known accuracy of real world data in order to give the appearance of greater validity for their claims. | A recent example of pseudoscientific deception by precision include certain economists suggesting that "a Keynesian multiplier of 1.57" specifically applies for government stimulus spending, when a wide range of studies suggest the actual multiplier may be "anywhere from 0 to 1.5" (note the difference in the number of decimal places and potential range of values!) |
Today's example isn't so much about decimal places as it is representative of the kind of deception that results when precisely calculated values are placed into an inappropriate context. Let's go over the details....
A chart similar to the one below was included in a blog post under the heading “Bank C&I Loan Charge-Offs Soaring Again”. This chart caught my attention because it seems to indicate that bank C&I (Commercial and Industrial) loan charge-offs are happening at one of the fastest rates of the past 30 years — the sort of rate that would be consistent with the US economy being in recession.

The problem is that the above chart shows the percentage change of a percentage, which opens up the possibility that what is in reality a small increase is being made to look like a large increase. For example, an increase from 1% to 2% over the course of a year in the proportion of loans charged-off would be a 100% increase if expressed as a year-over-year percentage change in the percentage of charge-offs, whereas all you’ve actually got is a 1% increase in the total proportion of loans that have been charged-off.
The next chart is based on exactly the same data, but instead of displaying the year-over-year percent change in the percentage of C&I loans that have been charged off it simply displays the percentage of C&I loans that have been charged off. This is not just a more correct way of looking at the data, it is a way that has not given any false recession signals over the past 30 years.

The first chart’s message is: an economic recession is either in progress or imminent. The second chart’s message is: the US economy is not in recession and is presently not close to entering recession.
The same data, opposite messages.
No matter how you slice it, the presentation of a percentage change of a percentage is always highly misleading, even if mathematically correct. At the very least, it is more than one step removed from the actual numbers used to calculate the original percentage, which is the appropriate context in which the percentage can be understood.
Believe it or not, the use of percentage changes of percentages in place of the more accurate and direct presentation of percentage changes of numbers can have legal consequences, as Republican members of Arizona's state legislature discovered in 2008.
Judge orders rewrite of sales tax analysis
PHOENIX — A state judge ordered late Friday that the description of a proposed tax increase for transportation be rewritten to exclude a calculation of how much the levy will increase.
The description is to be put into pamphlets mailed to the home of every registered voter.
Maricopa County Superior Court Judge Edward Burke said it may be "mathematically correct" to say that Proposition 203, which would boost state sales taxes from 5.6 cents on every dollar spent to 6.6 cents, equals a 17.8 percent increase in what people will pay in sales taxes.
But the judge said such calculations "are likely to mislead many voters."
He accepted the arguments by Paul Eckstein, the attorney for tax backers, that the figure was deliberately inserted by Republican lawmakers to convince voters to reject the levy.
Mike Braun, who represents the Legislative Council, told Burke the law requires the panel to not only explain each ballot measure but also how approval would affect existing law.
He said it would be "helpful" to tell voters that whatever they are paying in state sales taxes would increase by 17.8 percent if Proposition 203 is adopted.
Eckstein, however, told the judge the accuracy of the calculation is beside the point.
"An analysis can be 100 percent accurate, and it can be unfair and misleading," he said.
Burke agreed.
For example, he said, raising the tax rate from one cent per dollar to two cents has an "absolute percentage increase" of 1 percentage point. But it has a "relative percentage increase" of 100 percent.
"Many voters are likely to confuse relative and absolute percent increases," the judge wrote.
As you can see, the components for the state sales tax example has a direct parallel component in the loan charge-offs example. The problem, as described by the judge in this case in non-mathematical terms, comes when the absolute percentages represented by the math above, the percentages of numbers, are confused with relative percentages, the percentage changes of percentages. The presentation of the relative percentages is misleading because their calculation is too many steps removed from the original base values from which the original percentages were calculated, which breaks the link to the specific context to which they are relevant.
In the case of today's example of junk science, it's the difference between suggesting that the risk of recession is imminent or of there being a comparatively low risk of recession in the near term. Given how different those outcomes are, expressing calculated values in the correct context is essential to avoiding the consequences that would come from taking the wrong actions in response to misleading information.
References
Saville, Steve. You can make statistics say whatever you want. The Speculative Investor. 19 July 2016. Republished with permission.
Political Calculations. How To Detect Junk Science. [Online Article]. 19 August 2009.
Labels: junk science
With so much destructive flooding in Louisiana during the past week, we couldn't help but think back to this past June, when the region around Houston, Texas experienced a tremendous amount of rainfall that also led to significant flooding and lots of property damage.
But one resident in the town of Rosharon, Texas beat the flood, using some remarkable technology developed in Louisiana for the purpose of preventing property damage. The following video tells the tale.
At $8,300, the cost of the residential AquaDam may seem high, but for those who live in flood prone areas, where flooding can cause property damage that can exceed several hundred thousand dollars, it may be a pretty reasonable investment. And the best part is that with the right combination of pumps, homeowners could actually use the same water that might otherwise destroy the value of their homes to protect them.
The question of whether its worth the cost however comes down to a combination of how much risk there is of property damaging flooding and the impact of how costly it could be. To estimate if it is worth the cost, as a general rule of thumb, you can multiply the cost of potential property damage by the probability that flooding will damage the property over an extended period of time. If that number is greater than or equal to the cost of using technology like the Aqua Dam to mitigate against the potential for damage, then it makes sense to invest in the technological solution.
It's not quite that cut and dried however, because there is a lot to be said for peace of mind if that number only falls short by a relatively small percentage, where choosing to invest in technology to overcome such a risk would come down to a personal choice.
The same principles apply for adaptation to climate change, where one could argue that this kind of technology could be more cost-effectively applied to provide additional protection to a levee, which if overtopped by flood waters, could easily result in millions of dollars of damage to an entire community. That may be especially true when the alternative course of action may involve an even more costly project to build up the levee.
Then again, the cost of the kind of technology to deal with such hazards may be so prohibitive that property owners may simply choose to buy extra insurance protection to pay for what it costs to clean up and recover after the damage happens, if and when it does.
And that's the rub. It all comes down to placing a bet on the statistical likelihood of something bad happening, which may or may not when it matters most to you. How much are you willing to wager to win on a choice like that? And how much are you willing to risk losing if you fall on that other side of the bet?
Update: Matt Kahn applies a little more complex math than what we described above to identify what kinds of people would choose to live in areas prone to flooding in the absence of government subsidized insurance protection (and by extension, since the math would be similar, technological protection).
Labels: risk, technology
Every three months, just about at the time that the market's quarterly earnings season ends shortly after the midpoint of the quarter, we take a snapshot of the expectations for future earnings in the S&P 500.
Today, for the first time in the last seven quarters, the trailing twelve month average of the S&P 500's earnings per share has risen, which suggests that the earnings recession which took hold in the fourth quarter of 2015 may finally have bottomed.

Going by S&P's current projections, the index' trailing year earnings per share may return to its pre-earnings recession levels in the first quarter of 2017.
The improvement in the S&P 500's earnings may be directly attributed to the rebound of crude oil prices since they bottomed in early February 2016, which have eliminated the downward pressure on earnings that have prevailed in the market's oil production sector since the end of June 2014.
Through Monday, 15 August 2016, the price of West Texas Intermediate crude oil at the Cushing, Oklahoma terminal stood at $45.72 per barrel, a nearly 75% improvement over the $26.19 per barrel it bottomed at back on 11 February 2016. Oil prices would have to rise by another 136% from that $45.72 per barrel figure to return to the $107.95 per barrel that was recorded on 20 June 2014.
We think that for S&P's latest projection of future earnings to hold, oil prices would have to continue their overall rise. However, since the current quarter of 2016-Q3 began, those prices have been somewhat choppy, so we think it is more likely that the recovery of the S&P 500's earnings per share to levels back above their pre-earnings recession levels will take longer than S&P projects.
This increase in the S&P 500's trailing year earnings per share is the first real positive news that the market has seen for its earnings prospects since mid-2014, and particularly the oil producing sector of the market. After having fallen for six consecutive quarters, it's about time that industry had some good news show up on its bottom line.
Data Source
Silverblatt, Howard. S&P Indices Market Attribute Series. S&P 500 Monthly Performance Data. S&P 500 Earnings and Estimate Report. [Excel Spreadsheet]. Updated 12 May 2016. Accessed 19 August 2016.

InsureBlog's Hank Stern reached out to us last week in connection with an effort to link blogs and other social media outlets with support for much needed disaster relief in the flooding-struck Gulf Coast region of the U.S. We're going to keep the ball rolling by pointing to a number of disaster relief resources that should draw your attention no matter where in the world you are.
With much of the worst flooding having taking place in Louisiana's Acadiana region, a great place to start identifying ways to make the biggest difference with your donation or your volunteer efforts can be found through Baton Rouge's CBS affiliate WAFB's site, which has been regularly updating a list of needs and volunteer opportunities in the region.
We've also selected a handful of charitable organizations that are focused on providing disaster relief across Acadiana, which are tied to national organizations that have been ranked highly by Consumer Reports and the Christian Science Monitor for their effectiveness in putting donated funds into real relief efforts.
- American Red Cross
-
The American Red Cross has channels to either support taking your donations to support their efforts or to direct you to where hands-on volunteers are needed, including for blood donations.
- United Blood Services
-
One of the things we learned during the aftermath of Hurricane Katrina is how rapidly available blood supplies across the nation can dwindle because of the disruption of blood donations in the disaster-affected area of Louisiana and the Gulf Coast. Going to your local Red Cross or UBS blood donation center or participating in a blood drive can do a lot to alleviate a potential shortage that would now in the making.
- Catholic Charities Archdiocese of New Orleans
-
Much of the flooded area falls within the parishes served by the archdiocese of New Orleans, which has a well established distribution network to provide disaster relief services in this area.
- Salvation Army
-
The Baton Rouge, Louisiana Corps of the Salvation Army is actively engaged in providing assistance to families displaced by flooding and is also very much in need of volunteers to support its efforts.
- The United Way
-
There are two branches of United Way that are well positioned to provide disaster relief: United Way of Acadiana and United Way of Southeast Louisiana, both are accepting online donations.
We would be remiss if we didn't recognize how social media is making disaster relief efforts more effective. To that end, we're really impressed by an organization that didn't exist during the days of Hurricane Katrina, but which has already made a big difference in its short history: Crisis Cleanup. Here's a good description of what they're about:
How do you direct 30,000 volunteers from 100 organizations to 5,000 locations across a 500-mile arc in 8 weeks?
You don't. You let them organize themselves.
Crisis Cleanup empowers relief organizations to instantly coordinate response efforts in real time, redirecting thousands of volunteers from to waiting lines to survivors' basements.
Crisis Cleanup was developed by and for field volunteers, team leaders, canvassers, and the people who work one-on-one with survivors whose homes have been affected by flood, tornadoes, earthquakes, wind, fire, or other disaster. Crisis Cleanup can respond to a new disaster the same day, permitting relief organizations to instantly coordinate efforts.
Crisis Cleanup implements a "Craigslist" philosophy to recovery efforts– organizations that are aware of work orders enter them into the system, and organizations with capacity to help can claim and perform the work. The system is not public, but it is open and transparent among participating organizations. No centralized organization is "in charge." This non-threatening approach minimizes duplication and maximizes communication, coordination, and efficiency.
While entering a client into Crisis Cleanup does not guarantee that he or she will be served, it guarantees visibility and maximizes the chances for assistance, while helping relief organizations prioritize their limited resources.
It's been over 10 years since the flooding from Hurricane Katrina demonstrated the need for this kind of decentralized coordination tool for making relief efforts more effective. We're excited to see this particular evolution in how disaster assistance is directed.
Labels: ideas
August 2016 is going to be a long month. We're three weeks into it with two more to go and already, with no sign as yet the summer doldrums in the S&P 500 are anywhere near ready to give way to volatility.
Not that there's anything wrong with that - as an investor, a not-so-volatile, yet almost painfully slow general rise in stock prices is a good thing. Especially as compared to the fireworks that created the echo effect in our standard model's projections of the S&P 500's stock prices through the rest of the quarter.

The echo effect is the result of our futures-based model's use of historic stock prices as the base reference points from which we project the alternative trajectories that the S&P 500 is likely to follow into the future based upon how far forward in time investors are looking in setting their expectations when making their current day investment decisions. In this case, the echo effect began wreaking havoc with our standard model's projections on Thursday, 18 August 2016, on the anniversary of the beginning of China's August 2015 stock market meltdown.
To try to improve the accuracy of our model during the periods where we know in advance that its projections will be less accurate as a result of the echo effect, we've substituted the average daily trajectory that the S&P 500 has taken through this period of the year, based on historic stock price data going back to 1950, which smoothes out the echo of last year's volatility. The following chart shows how well that worked during the first two days in which we have to compensate for the echo effect.

Overall, so far, so good, but it's way too early to make any sort of judgment call on how well this modified method will work out to be. At this point though, it is pretty safe to say that Week 3 of August 2016 looks like it ended as it began, not to mention how it behaved in between, with investors appearing to be fairly closely focused on the distant future quarter of 2017-Q2 and the expectations associated with it in setting their investment decisions during the past week.
Compared to last year, that's good news. We'll have to wait to see if the next week will bring any excitement. Until then, here is a selection of market-related headlines that caught our attention during the past week.
- Monday, 15 August 2016
- Tuesday, 16 August 2016
- Wednesday, 17 August 2016
- Thursday, 18 August 2016
-
- Dollar hits nearly eight-week low against euro day after Fed minutes - here's a hint: the Fed minutes have nothing to do with this development - if they did, it would have happened the day before (that prices respond very quickly to new information is one part of the Efficient Markets Hypothesis that works pretty reliably....)
- Wall St. inches up with energy pain, Wal-Mart
- Fed's Williams says rate hikes 'make sense,' and sooner than later - Aren't these guys supposed to be in Jackson Hole this month? Can't they shut up until they get there?
- Friday, 19 August 2016
For a listing of the week's positives and negatives as it relates to the markets and the economy, be sure to check out Barry Ritholtz' succinct summation of the week's events.
Wearable computing technology has a bad track record. Inventions like Google Glass is considered to be an epic fail by some. Meanwhile, Apple Watch has been somewhat more successful, but is still considered to be an application of technology that still isn't ready for prime time.
That's why we were intrigued to see Sony enter the field with U.S. Patent 9,417,106 earlier this week with what must be the future of success in wearable computing technology, in which all the technology is integrated into a wig!

If Sony is right, what once was the height of fashion in the 17th and 18th centuries could rock the fashion world of the 21st century!
Sony's inventor team describes the advantages that might be realized by integrating input and output computing devices into today's toupees (emphasis ours):
One of the aspects of the present disclosure is the usage of a wig and the integration of the components of the computing device into this wig. The usage of a wig has several advantages that, compared to known wearable computing devices, include a significantly increased user comfort and an improved handling of the wearable computing device. As the at least one sensor, the control unit and the communication interface are arranged in the wig, most of the components or all components of the wearable computing device are covered by the wig and are, thus, not visible. Therefore, the user can wear the wearable computing device as a regular wig while looking natural at the same time. Secondly, a wig covers at least a part of the user's head or the entire head of the user, so that there is enough space to place the components of the computing device, i.e. the at least one sensor, the control unit and the communication interface, without limiting the user in his daily life activities. The components of the computing device, i.e. the at least one sensor, the control unit and the communication interface, are preferably arranged within the wig in order to be placed on a peripheral area of the head when the wig is worn by the user. The wearable computing device can thus detect a wide variety of information.
A further advantage relies on the fact that the head area is more sensitive than other body parts, such as a foot, a hand or the waist of the user, where the wearable computing devices known from the prior art are usually arranged. The arrangement within a wig that is adapted to cover at least a part of the user's head enables the user to immediately react even if the computing device provides only small or weak feedbacks. The fact that users instinctively protect their heads more than other body parts is also advantageous, since more sensitive sensors and other computing components may be used without the risk of getting damaged. Moreover, the wearable computing device according to the present disclosure can be easily combined with other wearable devices, such as computer glasses or smart phones.
Finally, an integration of a computing device into a wig as proposed according to the present disclosure enables a usage in many daily life situations. The wig itself may have a fancy or funny appearance, but may also have an inconspicuous appearance so that other people in the surrounding of the user may not even take notice of the wearable computing device. In contrast to wearable computing devices known from the art, the wearable computing device proposed in this disclosure thus has the potential to become very popular and commonly used. The proposed device could even be used as a kind of combined technically intelligent item and fashion item at the same time.
Wigs are useful to enhance a user's appearance and change other's impressions because different hairstyles give different impressions. Thus, many people use wigs. Especially bald people that usually wear wigs in their daily life could take advantage of the wide variety of functions that are provided by the wearable computing device proposed herein. However, other conceivable appliances are film or playing actors that commonly use wigs to play different roles. Also, many so-called "cosplayers" (costume players: a form of role-play) wear wigs and costumes to imitate their favourite characters in comics and animated films. In all cases, users wear wigs to enhance their appearance. However, it is to be noted that the wearable computing device proposed herein may be worn by any people, even by people who usually do not wear wigs.
The future just got a lot more weird than it used to be!
Other Stuff We Can't Believe Really Exists
- Inventions in Everything: The WiFi Wig
- Inventions in Everything: Keeping Dog Time
- Inventions in Everything: Texting Your Dog a Treat
- Inventions in Everything: The Baby Cage
- The Alarm Clock of Damocles
- Inventions in Everything: The Toilet Snorkel
- Inventions in Everything: Antiterrorism Barriers
- Inventions in Everything: Geothermal Beer Coolers
- Inventions in Everything: The Salmon Cannon
- Powdered Wine: Just Add Water!
- Fail: The Newest Innovation in Ice Cream
- Unlimited Virtual Legos
- Inventions in Everything: The Ultimate Turkey Blind
- Inventions in Everything: Turning Cans Into Sippy Cups
- Inventions in Everything: Anatomical Lego Figures
- It's Not What You Think....
- Inventions in Everything: Soup Bowl Attraction
- Inventions in Everything: Making Life More Difficult
- Inventions in Everything: The Oreo Separator Machine
- Air Shark!
- Markets in Everything: Stormtrooper Motorcycle Suit
- The Bike That Rides You
- One Inventor's Stick-to-itiveness
- High Five!
- Inventions for Everything
- The Best Mousetrap Ever
- An Invention for the True Wine Connoisseur
- Three of Ten Things You Don't Need on St. Patrick's Day
- The Future Just Got a Lot Cooler Than It Used to Be
- The Worst Piece of Design Ever Done
- The Magic Marker of the Future
- Coming Soon, to a Gym Near You!
Labels: technology
How much does the government benefit when new jobs are created within a community?

Previously, when we looked at the economic impact of new jobs, we only considered how the economy of a community might change from the addition of jobs added by a single new employer. However, we didn't address the situation where local governments use incentives to attract new employers, where the benefits they bring to a local economy are justified because of the tax revenue those new jobs might generate.
Whether or not those kinds of incentives might make sense for the community depends upon how much additional revenue those jobs bring, which is what we'll explore today.
In doing that, we'll only consider tax revenue generated through income and sales taxes. That means that we're excluding property taxes, since factors other than income can influence the amount of tax revenue generated, and which are also very location dependent (that's a different tool!)
In the tool below, you'll need to enter the number of jobs being contributed by the new employer and the average income for those jobs, along with the sales tax rate for the region where the jobs will be located. You'll also need to enter the average effective federal and state income tax rates that applies for the region, which you can estimate by entering the average income for the new jobs in Neuvoo's state income tax calculator to calculate both the federal and state income tax, then dividing each by the average income of the new jobs to get the rates.
Finally, you'll also need to enter the FICA payroll tax rate that applies for the employees of the new employer, which is currently 7.65%.
Because that's a lot of things to keep track of already, to help keep things simple, we'll only consider the direct jobs contributed by a single employer, without considering the job multiplier effect. If you want to consider that effect, just substitute the relevant income and tax rate information for those additional jobs in the tool below and add it to the total for the new employer's direct jobs.
That's it! Once you have that information, you're ready to plug your numbers into the tool below. If you're reading this article on a site that republishes our RSS news feed, click here to access a working version of this tool!
In the tool above, the default data comes from an example provided by the state of Oklahoma, which we selected because the methodology for finding these estimates was developed for that state by David Penn.
To apply this tool for your region of interest, just find the applicable data and plug it in! As a bonus, the tool will also provide an estimate of the lost tax revenue that might result when a business shuts down or otherwise leaves the region.
Previously, when we considered the psychological profile of pseudoscientists, we wondered if there wasn't an alternative checklist to the one we use for detecting junk science, but one that if followed, would lead to the opposite of junk science.
It occurred to us that there just might be and that it might be found in Jeremy Kun's "Habits of highly mathematical people"! Here's his story of how it came about as a response to a very common question heard by math teachers everywhere, along with the basic list.
The most common question students have about mathematics is "when will I ever use this?" Many math teachers would probably struggle to give a coherent answer, beyond being very good at following precise directions. They will say "critical thinking" but not much else concrete. Meanwhile, the same teachers must, with a straight face, tell their students that the derivative of arccosine is important. (It goes beyond calculus, in case you were wondering)
So here is my list. The concrete, unambiguous skills that students of mathematics, when properly taught, will practice and that will come in handy in their lives outside of mathematics. Some of these are technical, the techniques that mathematicians use every day to reason about complex, multi-faceted problems. Others are social, the kinds of emotional intelligence one needs to succeed in a field where you spend almost all of your time understanding nothing. All of them are studied in their purest form in mathematics. The ones I came up with are,
- Discussing definitions
- Coming up with counterexamples
- Being wrong often and admitting it
- Evaluating many possible consequences of a claim
- Teasing apart the assumptions underlying an argument
- Scaling the ladder of abstraction

Kun's essay is very much a RTWT, and for our money, the section on "being wrong often and admitting it" is perhaps the most valuable aspect of it. Long time readers of Political Calculations know that we actually enjoy acknowledging when we've been wrong or have made errors in our analysis, because we learn more as part of the process of getting to the truth, which is where we really want to get in doing what we do. That's why we take time to describe how to replicate the mistakes we've made and also why we even thank those who identify our errors for the improved insights that result from correcting the mistakes!
True story. Earlier this year, in replicating an analysis that Mark Perry did, we identified a problem with the data he used that meant that it could not support his findings. After we alerted him to the issue, he was extraordinarily gracious and in fact, went the extra mile to consult with others to identify if there might be other issues with the data. He then updated his original post where he had presented his findings to identify and describe each the problems with the data that had been found.
That's a key difference between science and pseudoscience. Even though a mistake had been made, Perry took that mistake as a challenge to improve, and to do so in a way that would benefit others, which we would describe as model scholarly behavior. That contrasts with the actions of pseudoscientists who, when mistakes are found in their findings, often react by seeking to distract attention away from their mistakes, and who often resort to incredibly unscholarly behavior in doing so.
Mistakes are a fact of human life. It's how you recover from them that determines the kind of person you are.
Here's an excerpt of that portion of the essay:
Being wrong often and admitting it
Two mathematicians, Isabel and Griffin, are discussing a mathematical claim in front of a blackboard. Isabel thinks the claim is true, and she is vigorously arguing with Griffin, who thinks it is false. Ten minutes later they have completely switched sides, and now Isabel thinks it's false while Griffin thinks it's true.
I witness scenarios like this all the time, but only in the context of mathematics. The only reason it can happen is because both mathematicians, regardless of who is actually right, is not only willing to accept they're wrong, but eager enough to radically switch sides when they see the potential for a flaw in their argument.
Sometimes I will be in a group of four or five people, all discussing a claim, and I'll be the only one who disagrees with the majority. If I provide a good argument, everyone immediately accepts they were wrong without remorse or bad feelings. More often I'm in the majority, being forced to retrace, revise, and polish my beliefs.
Having to do this so often-foster doubt, be wrong, admit it, and start over-distinguishes mathematical discourse even from much praised scientific discourse. There's no p-value hacking or lobbying agenda, and there's very little fame outside of the immediate group of people you're talking to. There's just the search for insight and truth. The mathematical habit is putting your personal pride or embarrassment aside for the sake of insight.
It's such a contradiction to the kind of behavior that seems part and parcel with that of the peddlers of junk science. Please do RTWT - it's well worth your time!
What a difference two weeks can make. Two weeks ago, our regular sampling of dividend cut announcements indicated that July 2016 was easily the best month for the U.S. economy in a long time, bordering on levels we associated with relatively healthy growth conditions.
Two weeks later, the pace at which dividend cuts are being announced have increased, where now, they are once again consistent with at least part of the U.S. economy experiencing recessionary conditions. The following chart shows how the cumulative number of dividend cuts announced so far in 2016-Q3 compare to the cumulative number that was announced in the third quarter of 2015.

The good news is that 2016-Q3 is still much better than what we saw in both 2016-Q1 and 2016-Q2.

We did some digging into the historical data we've accumulated to identify what made July 2016 different from July 2015 in terms of what kinds of firms announced dividend cuts. Assuming that the same kinds of firms follow the same basic schedule for declaring dividends each year, the biggest difference came down to fewer firms in the mining and finance industries announcing dividend cuts in 2016 as compared to 2015, suggesting some year over year improvement in those sectors.
The good news is that we're almost done with 2016-Q3's earnings season, so we should see the number of dividend cuts being announced flatten out through the rest of the month. We'll check back sometime in early September 2016.
Data Sources
If you want to find out more about which specific firms are cutting their dividends now as compared to a year ago, here are the two main sources we use to create our sampling of dividend cut announcements.
Seeking Alpha Market Currents Dividend News. [Online Database]. Accessed 12 August 2016.
Wall Street Journal. Dividend Declarations. [Online Database]. Accessed 12 August 2016.
Labels: dividends
Although the S&P 500 reached new heights, the third week of August 2016 was really pretty boring as far as market action went!
The best way to describe what the market did during the week is that it drifted slightly higher, before drifing ever so slightly lower. As expected, investors appear to have maintained their focus on the distant future of 2017-Q2 in setting their expectations in making their current day investing decisions, which along with a lack of meaningful market moving news, largely accounts for the mostly steady trajectory of the S&P 500 during the week.

In the chart above, that small bump that you see in each of the alternative trajectories for the S&P 500 from 3 August 2016 to 11 August 2016 is the result of the echo of past volatility in stock prices, which is an artifact of our use of historic stock prices in the standard version of our futures-based model of how stock prices work. If you look ahead to later in this upcoming week, you'll see that the standard version of our model is about to be hit with a very large echo, as we're coming up on the anniversary of China's stock market meltdown, which began after China's surprise devaluation of its currency a year ago.
That's why we've developed a modified model, in which we're looking to substitute the past volalility-based echo effect with a more generic trajectory, as estimated using the typical trajectory that the S&P 500 has followed through each trading day of each year from 1950 through 2015.
Alternatively, we could just substitute another year's historic stock prices in our model, and in the past, we have with some success, as we effectively rebaseline our model with those historic prices.
But in doing so, we're really just trading one year's volatility for that of another year. For this experiment in forecasting, we're testing out whether a more generic trajectory can provide good enough results to improve the accuracy of our model's projections during those periods where we know in advance that our standard model will encounter the echo effect. The chart below shows what that looks like through the rest of 2016-Q3.

At least, if the market continues its low volatility behavior, we'll have something to hold our interest. Meanwhile, if you want proof that Week 3 of August 2016 was a pretty boring week for the S&P 500, here it is!
- Monday, 8 August 2016
- Tuesday, 9 August 2016
- Wednesday, 10 August 2016
-
- Oil ends down 2 percent as U.S. crude build offsets gasoline draw
- Wall Street drops as weak oil weighs on energy shares
- Oil fizzles on crude build; Wall St. ends lower
- Thursday, 11 August 2016
- Friday, 12 August 2016
Elsewhere, Barry Ritholtz succinctly summarizes the positives and negatives from the week's market and economic news.

In exploring the behaviors that characterize pseudoscientists, we came across a category that often part and parcel of what might be called the "pseudoscientific method", which isn't explicitly covered by our junk science checklist.
Via the Skeptical Raptor, a biologist who has made themselves the bane of the anti-vaxxer movement, is a description of behavior that we've also observed from confirmed pseudoscientists: Personalization of Issues. Here's how the Skeptical Raptor describes it:
Pseudoscience is often composed of closely tied social groups, and usually includes an authoritarian personality, suppression of dissent, and groupthink. This social construct can enhance the adoption of beliefs that have no rational basis. In an attempt to confirm their beliefs, the group tends to identify their critics as enemies. Pseudoscience also make false assertions or claims of a conspiracy on the part of the scientific community to suppress results that support the pseudoscience. Finally, they attack the motives or character of anyone who questions the claims, the argumentum ad hominem. As an example, the anti-vaccine crowd has invented numerous claims about Dr. Paul Offit, one of the great researchers in vaccines, just to attack him personally. They’ve done the same with Bill Gates.
Argumentum ad hominem, is something we have been accumulating quite a lot of examples to demonstrate, which we'll get around to at our leisurely convenience.
The amazing thing to us is it takes so very little to unleash a torrent of this kind of antisocial behavior from the practitioners of junk science, as we've found it comes with even the mildest of criticism. We strongly suspect that the typical pseudoscientist is someone who is very unpleasant to be around.
All you need to confirm if that is the case is to ask their colleagues and peers, who are often very happy to have someone from the outside listen to what they have to deal with at work every day. Provided they don't have to watch their backs if the personality in question is someone who also wields considerable power at their work or in their field.
Labels: junk science
Every year, there are thousands of wildfires all over the world that add to the amount of carbon dioxide in the Earth's atmosphere. While the amount of carbon dioxide that enters the air this way is much pales in comparison to that emitted by controlled human activities, wildfires never-the-less are a significant contributor to atmospheric CO2 levels.
That's one reason why we found the following world map from Global Fire Data fascinating, because it indicates the geographic origins of the fires that put the most carbon dioxide into the air in the years from 1997 through 2014.

The most surprising thing we learned from the chart is that the largest area where wildfires have burned to put the greatest amount of CO2 in the air is in central southern Africa. We had previously thought that Brazil's interior might be the largest region, but central southern Africa is clearly the largest area, followed next by central Africa.
The reddest regions on the chart were no surprise however, with Indonesia representing the region of the world whose fires have pumped the most carbon dioxide into the air with respect to the size of the relative amount of area burned, thanks largely to the burning of the large concentration of carbon-rich peat in its forests.
Speaking of Indonesia's wildfires, we're finally seeing the amount of CO2 entering into the Earth's atmosphere begin to fall, as measured at the remote Mauna Loa Observatory.

While Canada's Fort McMurray fire added to the increase in carbon dioxide in the Earth's atmosphere in recent months, it contributed far less than Indonesia's wildfires. As of July 2016, the year over year change in the amount of CO2 in the atmosphere has finally returned to levels where it previously peaked during the last decade.
But now we have a couple of questions. What was the timing of the African wildfires in the years from 1997 through 2014 and to what extent might they have contributed to the spikes we see in our chart? Being able to answer this question would make the measurement of atmospheric CO2 levels a better indicator of the Earth's economic activity, where we could better isolate the portion attributable to human activities.
And for those who would just rather watch the world burn, we would suggest this option for doing it in style!
Data Sources
National Oceanographic and Atmospheric Administration. Earth System Research Laboratory. Mauna Loa Observatory CO2 Data. [File Transfer Protocol Text File]. Updated 5 August 2016. Accessed 5 August 2016.
Labels: data visualization, environment
Welcome to the blogosphere's toolchest! Here, unlike other blogs dedicated to analyzing current events, we create easy-to-use, simple tools to do the math related to them so you can get in on the action too! If you would like to learn more about these tools, or if you would like to contribute ideas to develop for this blog, please e-mail us at:
ironman at politicalcalculations
Thanks in advance!
Closing values for previous trading day.
This site is primarily powered by:
CSS Validation

RSS Site Feed
JavaScript
The tools on this site are built using JavaScript. If you would like to learn more, one of the best free resources on the web is available at W3Schools.com.
Other Cool Resources
Blog Roll


